Copyright
©The Author(s) 2025.
World J Hepatol. Mar 27, 2025; 17(3): 103327
Published online Mar 27, 2025. doi: 10.4254/wjh.v17.i3.103327
Published online Mar 27, 2025. doi: 10.4254/wjh.v17.i3.103327
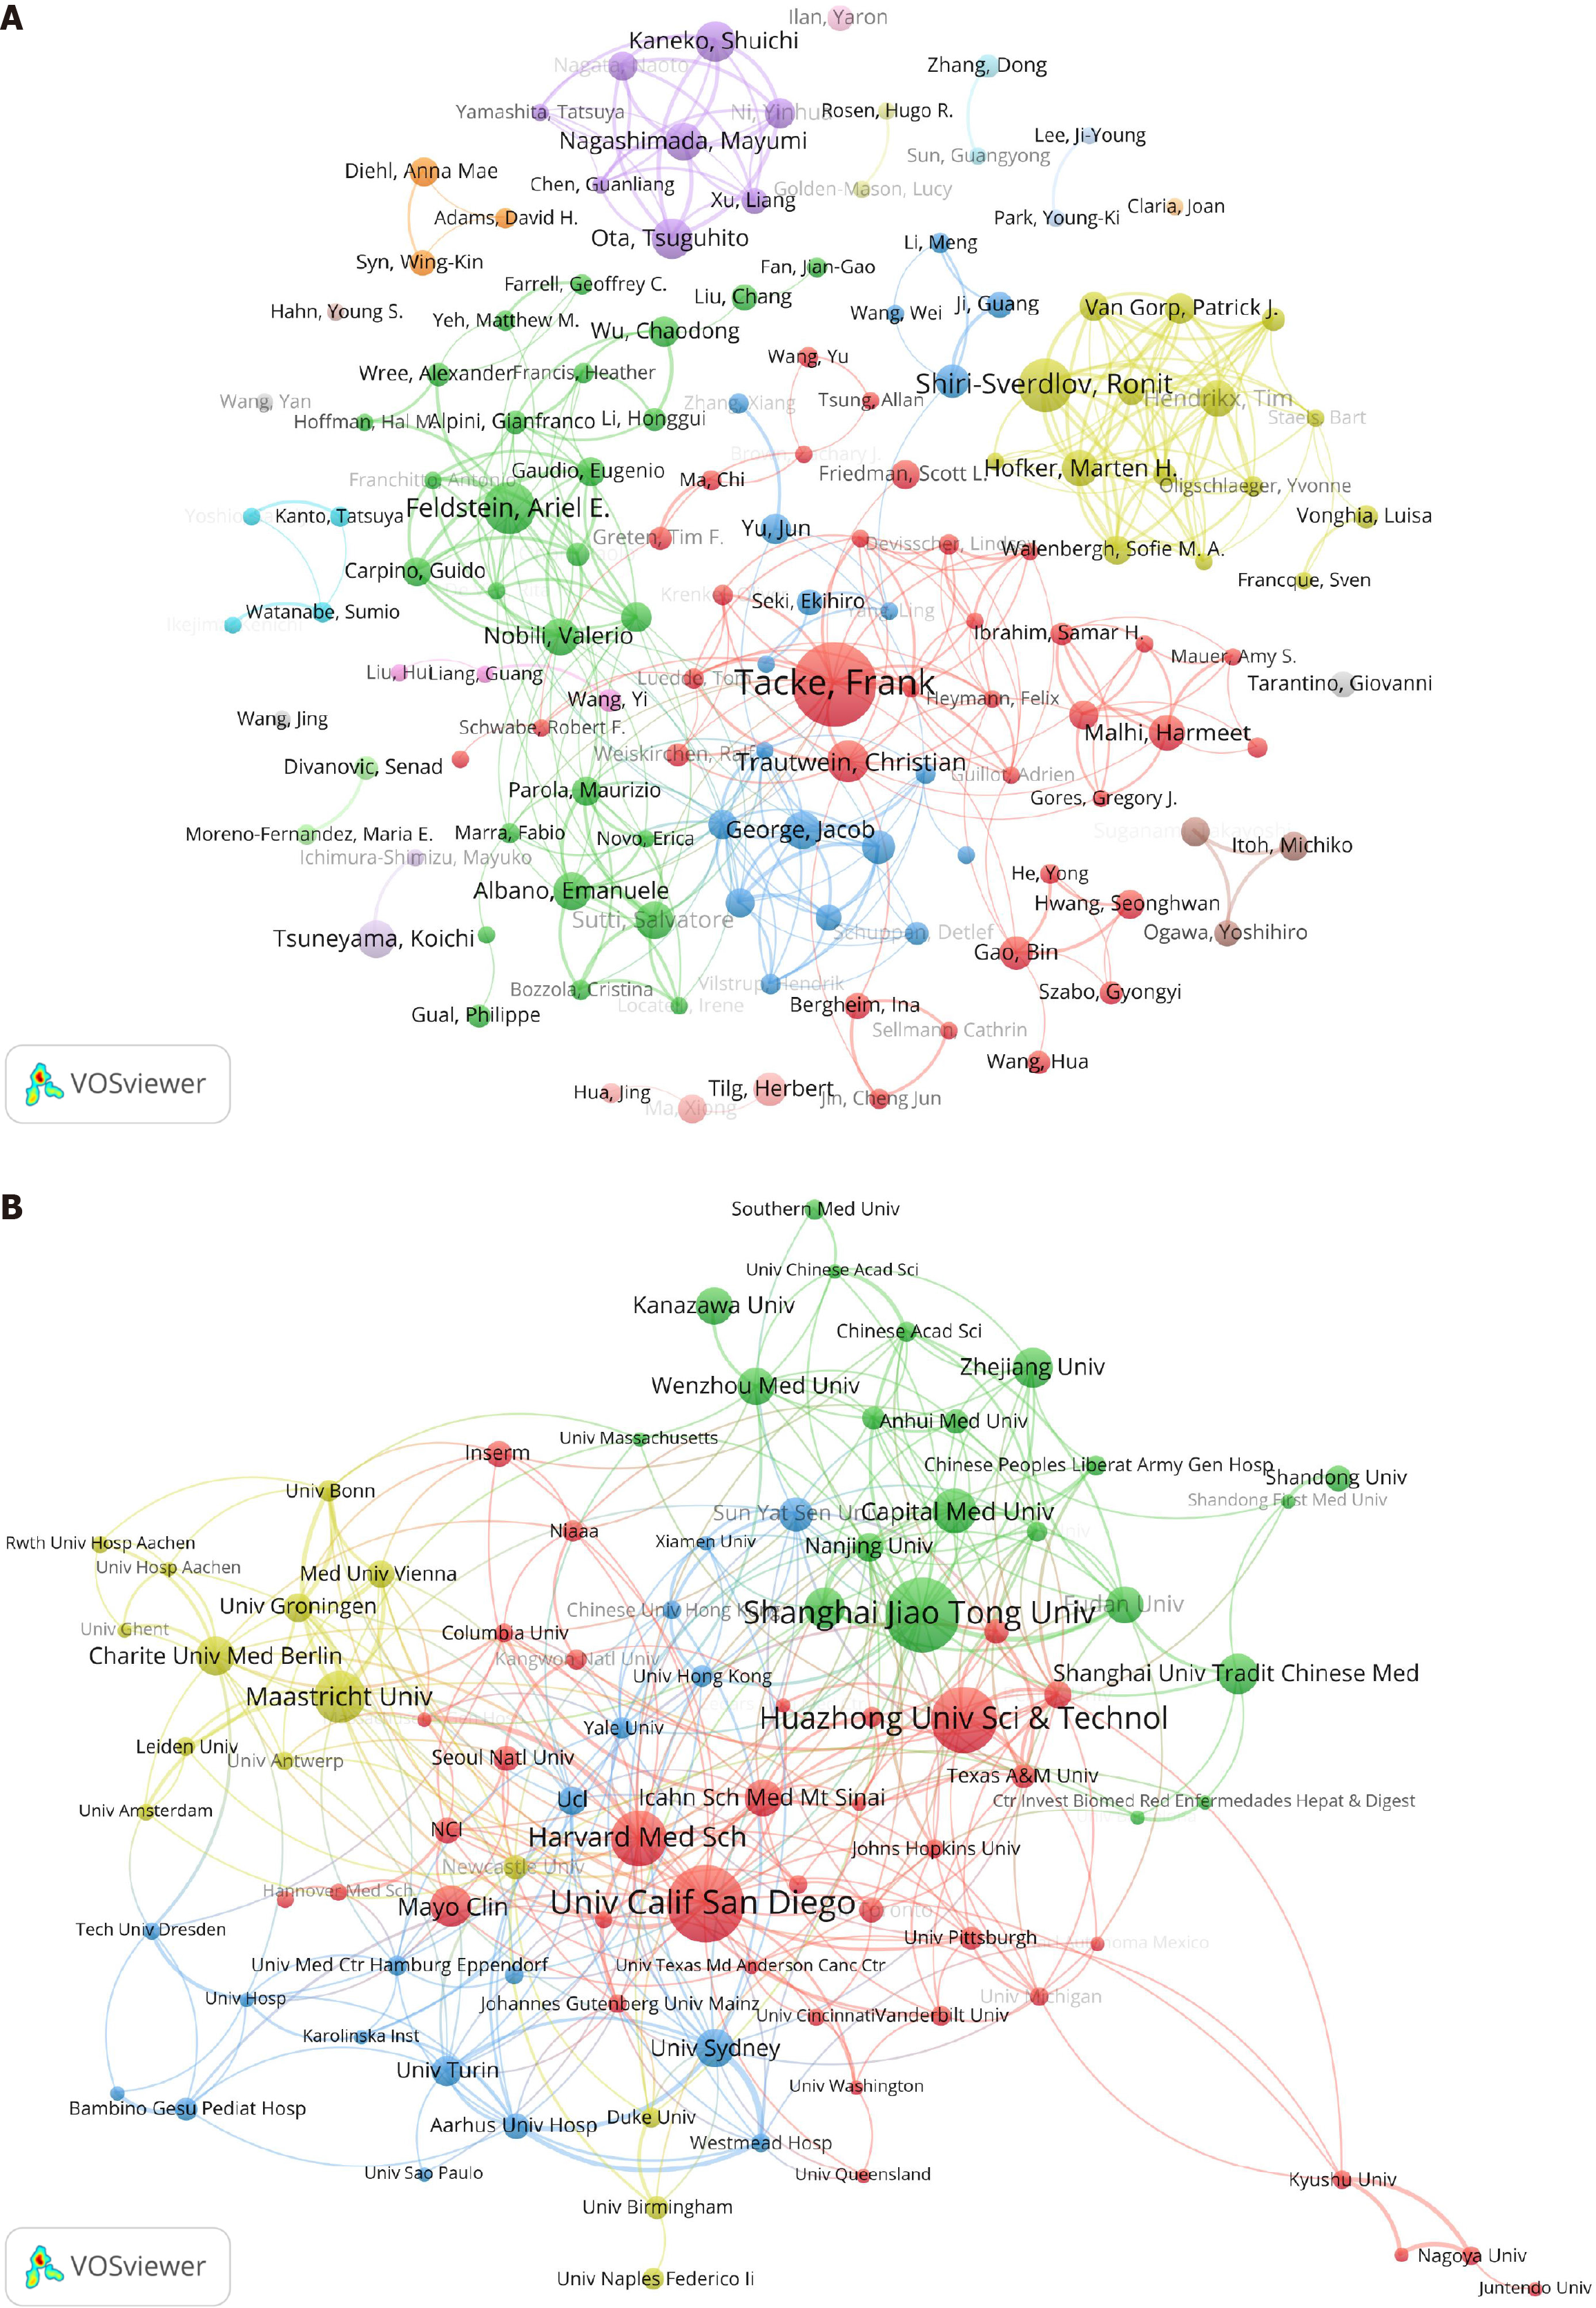
Figure 3 Distribution of authors and research institutions.
As shown in the figure, the nodes are composed of circles and text labels, with different colors representing distinct clusters. The thickness of the lines between circles indicates the strength of collaboration between authors/institutions. A: A visual map for VOSviewer network among authors; B: A visual map for VOSviewer network among institutions.
- Citation: Qi WY, Zheng SH, Li SZ, Wang W, Wang QY, Liu QY, Li XK, Zhang JX, Gan DN, Ye YA, Zao XB. Immune cells in metabolic associated fatty liver disease: Global trends and hotspots (2004-2024). World J Hepatol 2025; 17(3): 103327
- URL: https://www.wjgnet.com/1948-5182/full/v17/i3/103327.htm
- DOI: https://dx.doi.org/10.4254/wjh.v17.i3.103327


