Copyright
©The Author(s) 2025.
World J Hepatol. Mar 27, 2025; 17(3): 103261
Published online Mar 27, 2025. doi: 10.4254/wjh.v17.i3.103261
Published online Mar 27, 2025. doi: 10.4254/wjh.v17.i3.103261
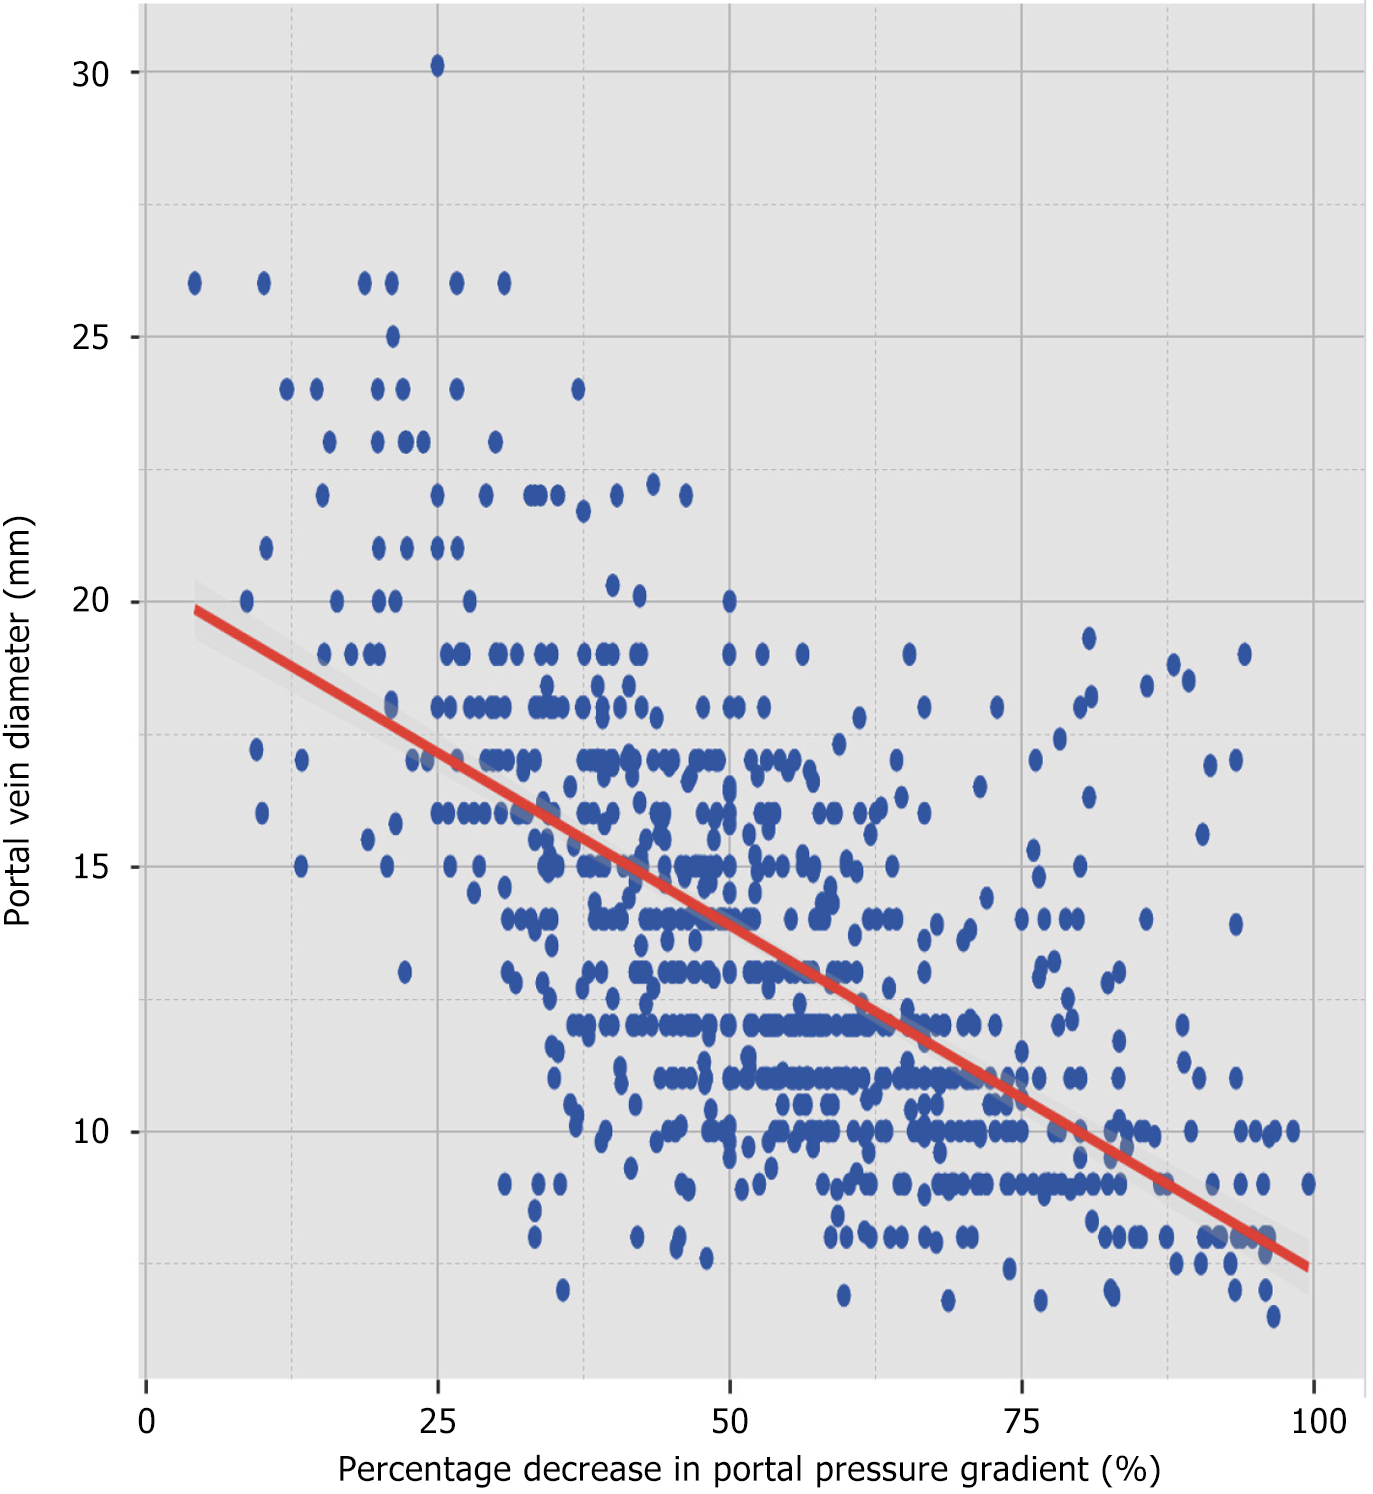
Figure 6 Scatter plot illustrating the negative correlation between portal vein diameter and percentage decrease in portal pressure gradient.
The red line represents the linear regression trend.
- Citation: Wang ZB, Zhu B, Meng MM, Wu YF, Zhang Y, Li DZ, Tian H, Wang FC, Lv YF, Ye QX, Liu FQ. Effect of portal pressure gradient reduction on outcomes after transjugular intrahepatic portosystemic shunt in portal hypertension patients. World J Hepatol 2025; 17(3): 103261
- URL: https://www.wjgnet.com/1948-5182/full/v17/i3/103261.htm
- DOI: https://dx.doi.org/10.4254/wjh.v17.i3.103261


