Copyright
©The Author(s) 2025.
World J Hepatol. Mar 27, 2025; 17(3): 103261
Published online Mar 27, 2025. doi: 10.4254/wjh.v17.i3.103261
Published online Mar 27, 2025. doi: 10.4254/wjh.v17.i3.103261
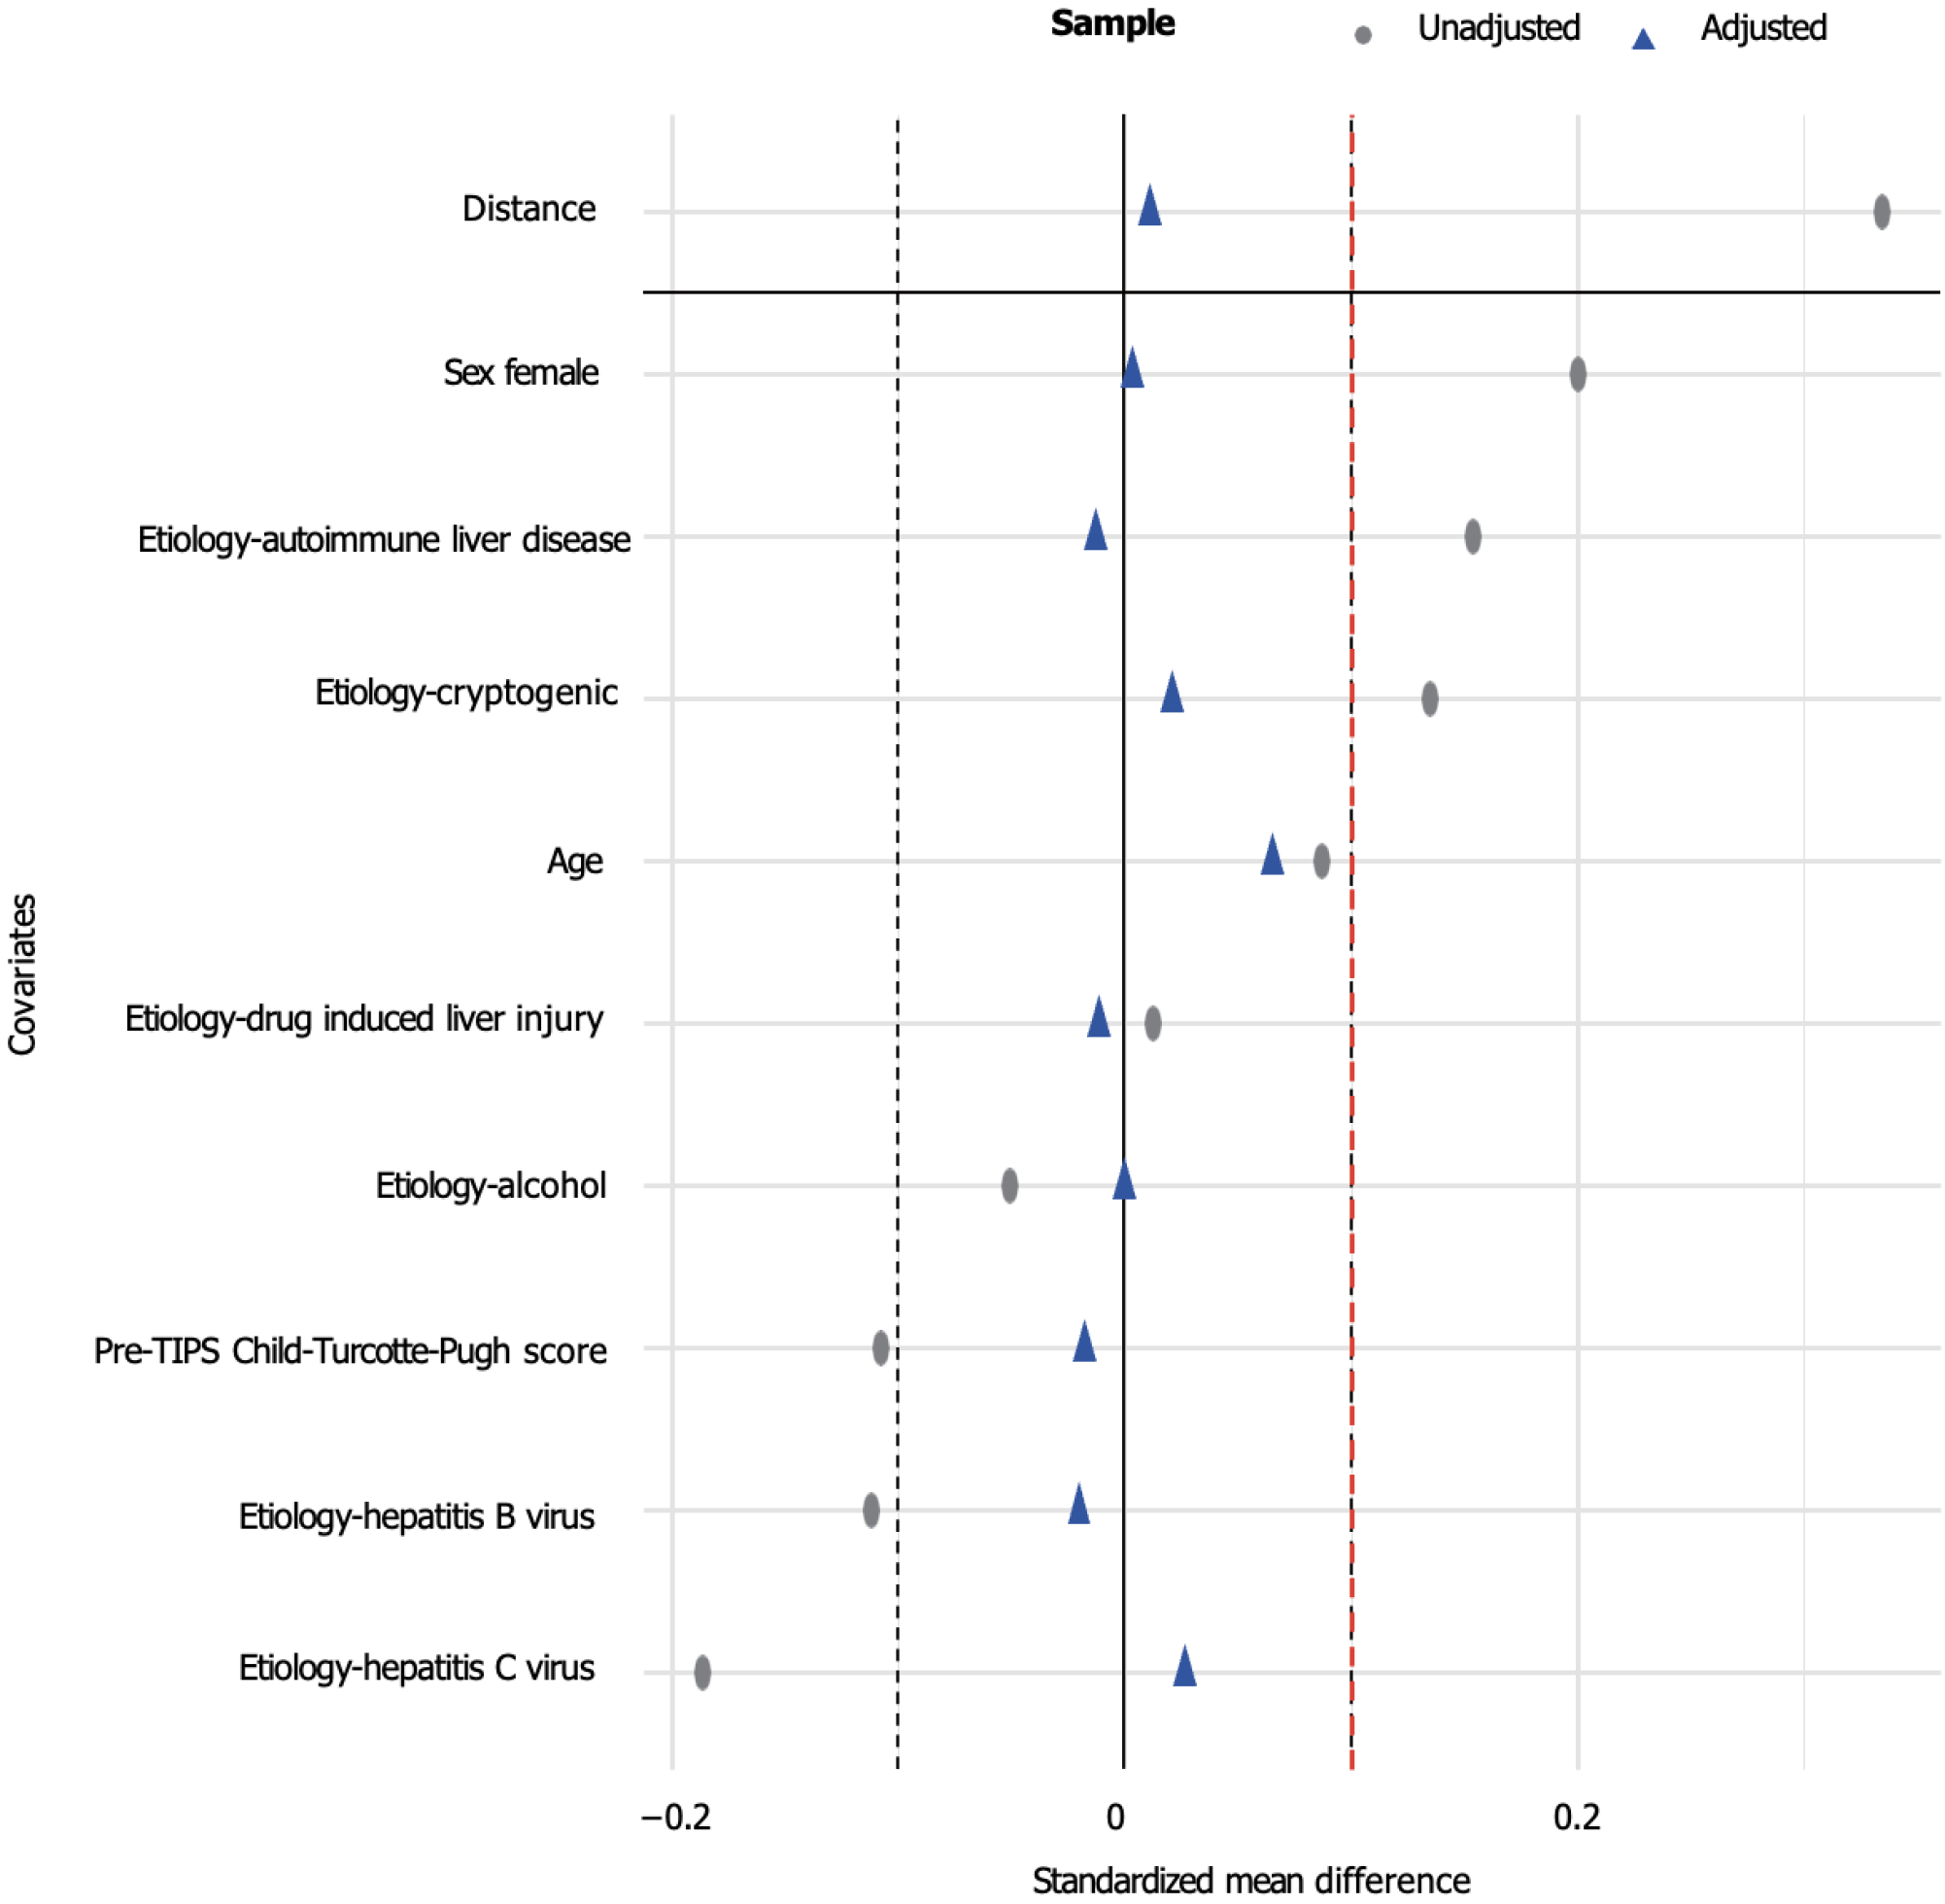
Figure 2 Comparison of standardized mean differences pre- and post-propensity score matching.
Gray circles indicate standardized mean differences before matching, and blue triangles represent standardized mean differences after matching.
- Citation: Wang ZB, Zhu B, Meng MM, Wu YF, Zhang Y, Li DZ, Tian H, Wang FC, Lv YF, Ye QX, Liu FQ. Effect of portal pressure gradient reduction on outcomes after transjugular intrahepatic portosystemic shunt in portal hypertension patients. World J Hepatol 2025; 17(3): 103261
- URL: https://www.wjgnet.com/1948-5182/full/v17/i3/103261.htm
- DOI: https://dx.doi.org/10.4254/wjh.v17.i3.103261


