Copyright
©The Author(s) 2025.
World J Hepatol. Mar 27, 2025; 17(3): 101721
Published online Mar 27, 2025. doi: 10.4254/wjh.v17.i3.101721
Published online Mar 27, 2025. doi: 10.4254/wjh.v17.i3.101721
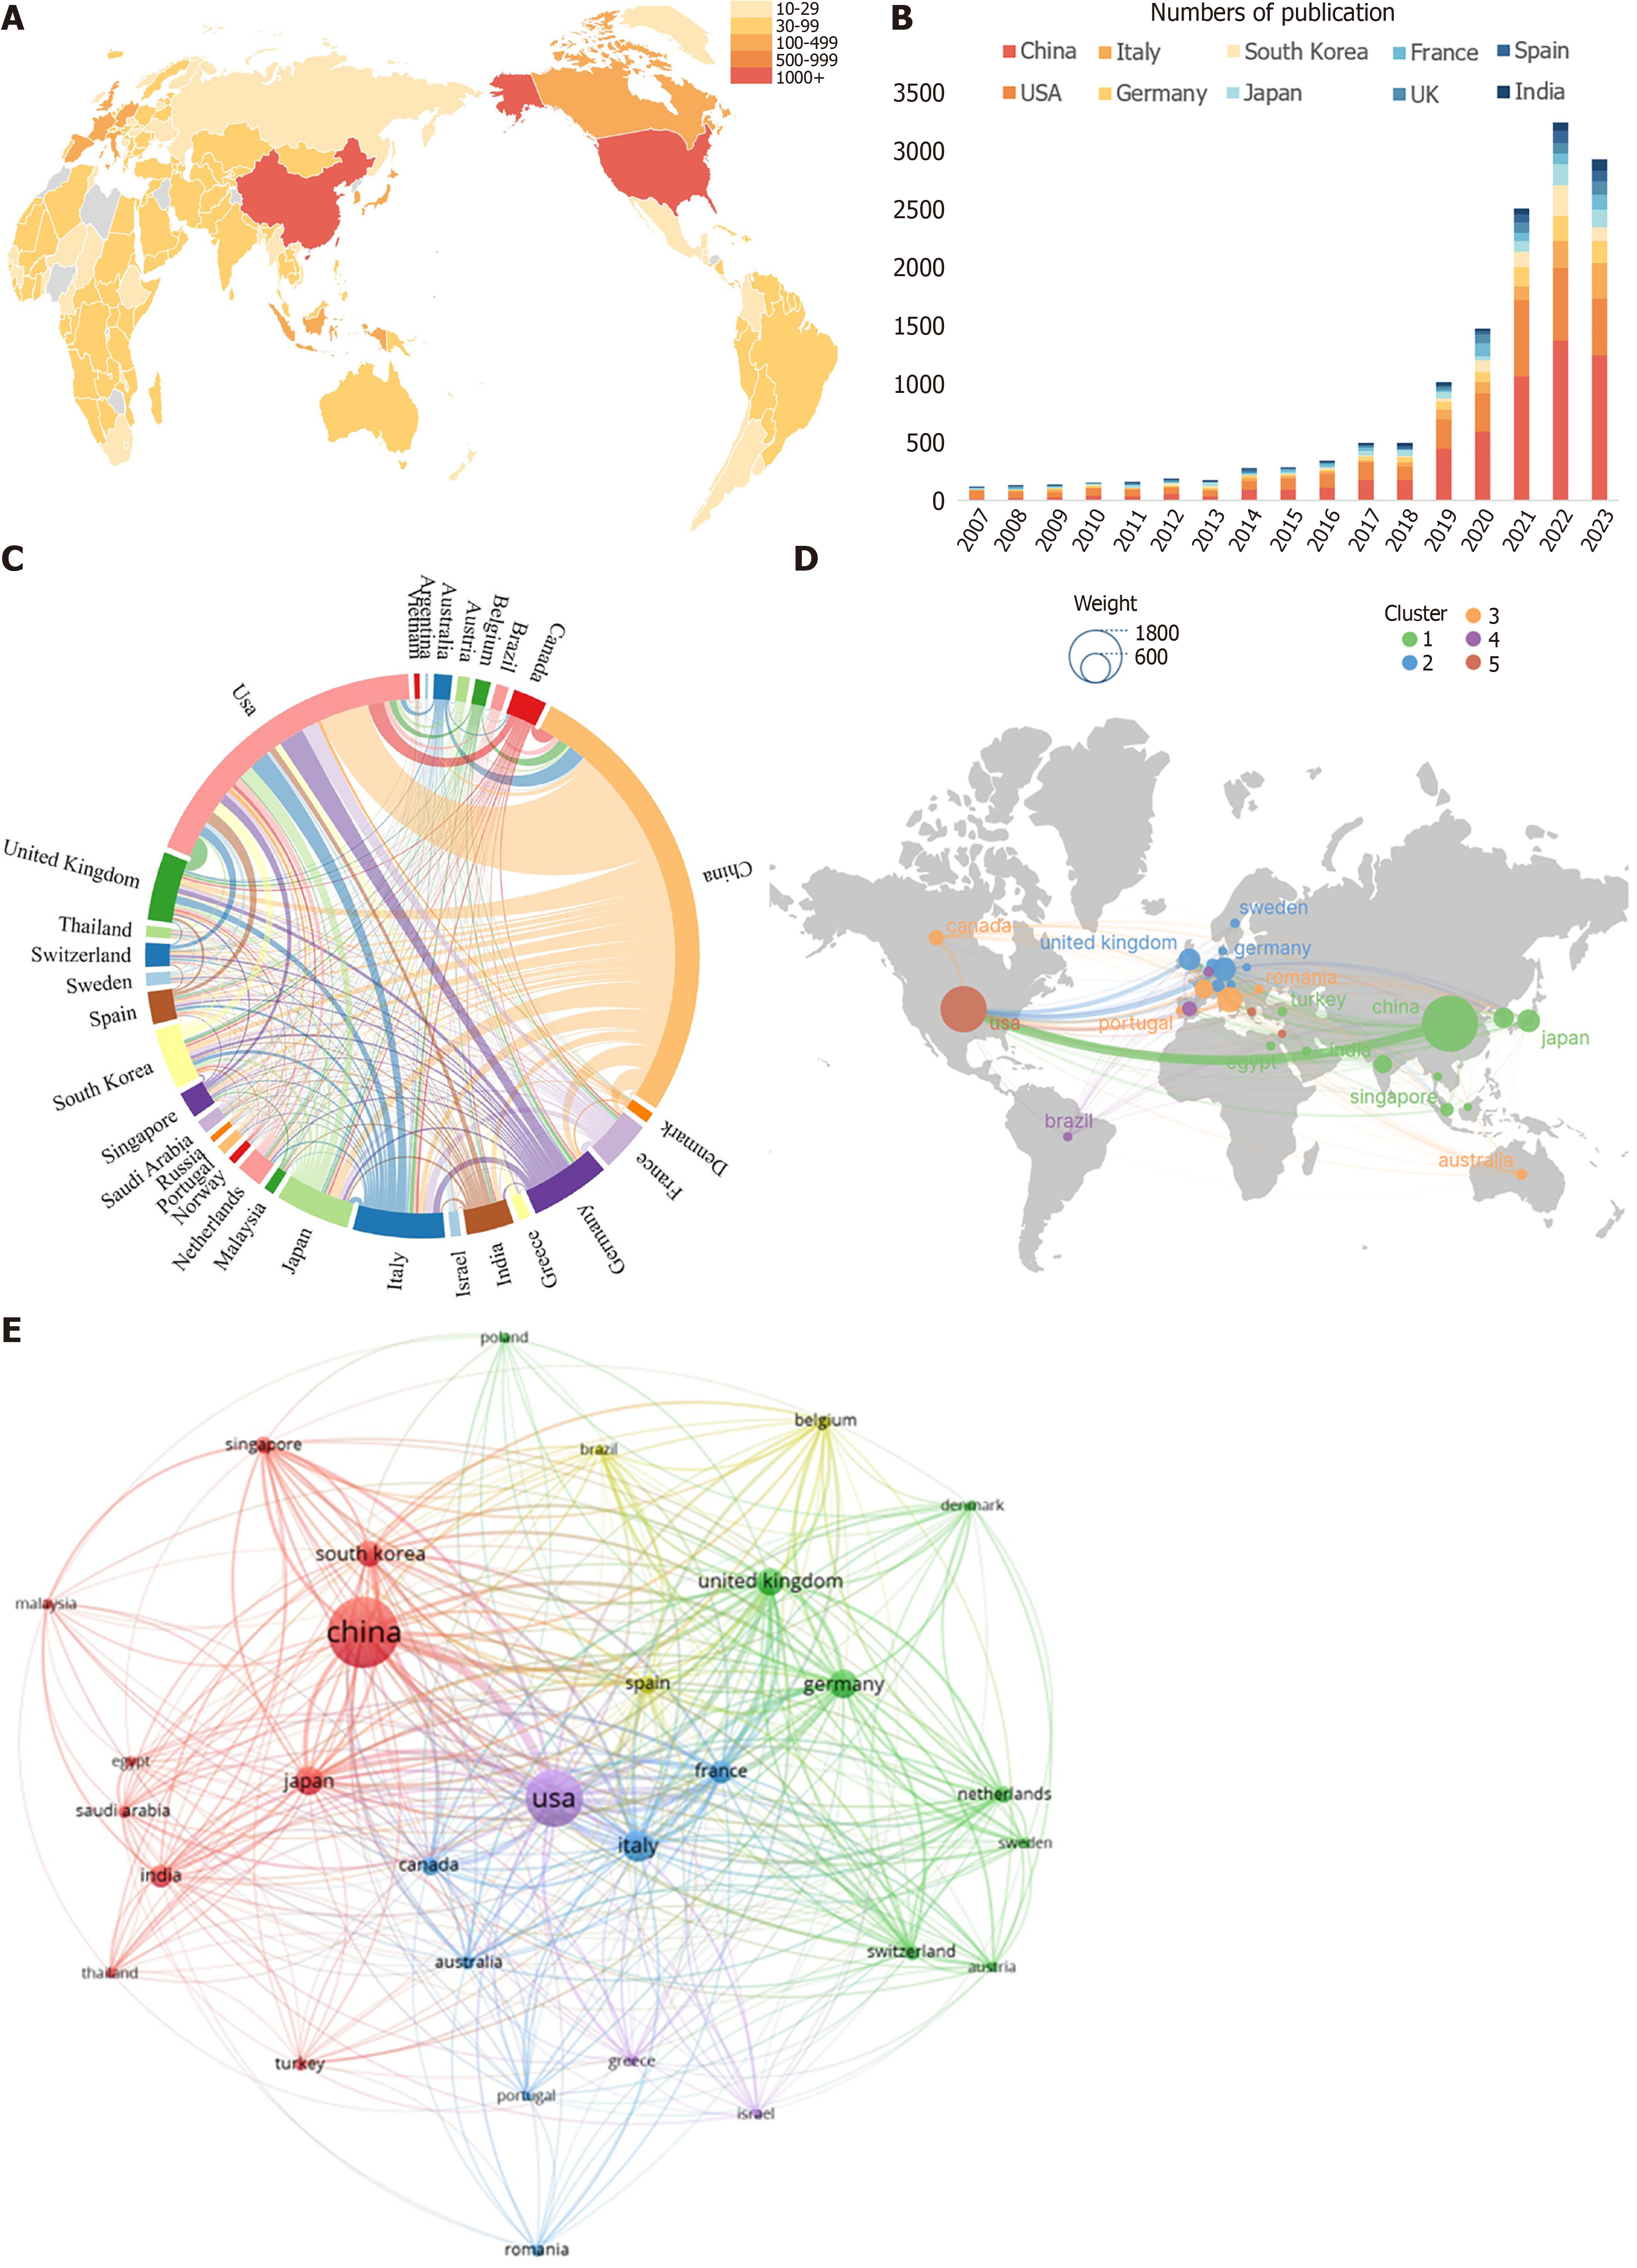
Figure 3 Visualization of publications and cooperation between countries.
A: A world map color-coded by the number of publications per country; B: A bar graph showing the number of publications from the top 10 most productive countries from 2007-2023; C-E: The map of international cooperation has been produced via a website (https://charticulator.com), Scimago Graphica, and VOSviewer.
- Citation: Zhou XQ, Huang S, Shi XM, Liu S, Zhang W, Shi L, Lv MH, Tang XW. Global trends in artificial intelligence applications in liver disease over seventeen years. World J Hepatol 2025; 17(3): 101721
- URL: https://www.wjgnet.com/1948-5182/full/v17/i3/101721.htm
- DOI: https://dx.doi.org/10.4254/wjh.v17.i3.101721


