Copyright
©The Author(s) 2025.
World J Hepatol. Mar 27, 2025; 17(3): 101340
Published online Mar 27, 2025. doi: 10.4254/wjh.v17.i3.101340
Published online Mar 27, 2025. doi: 10.4254/wjh.v17.i3.101340
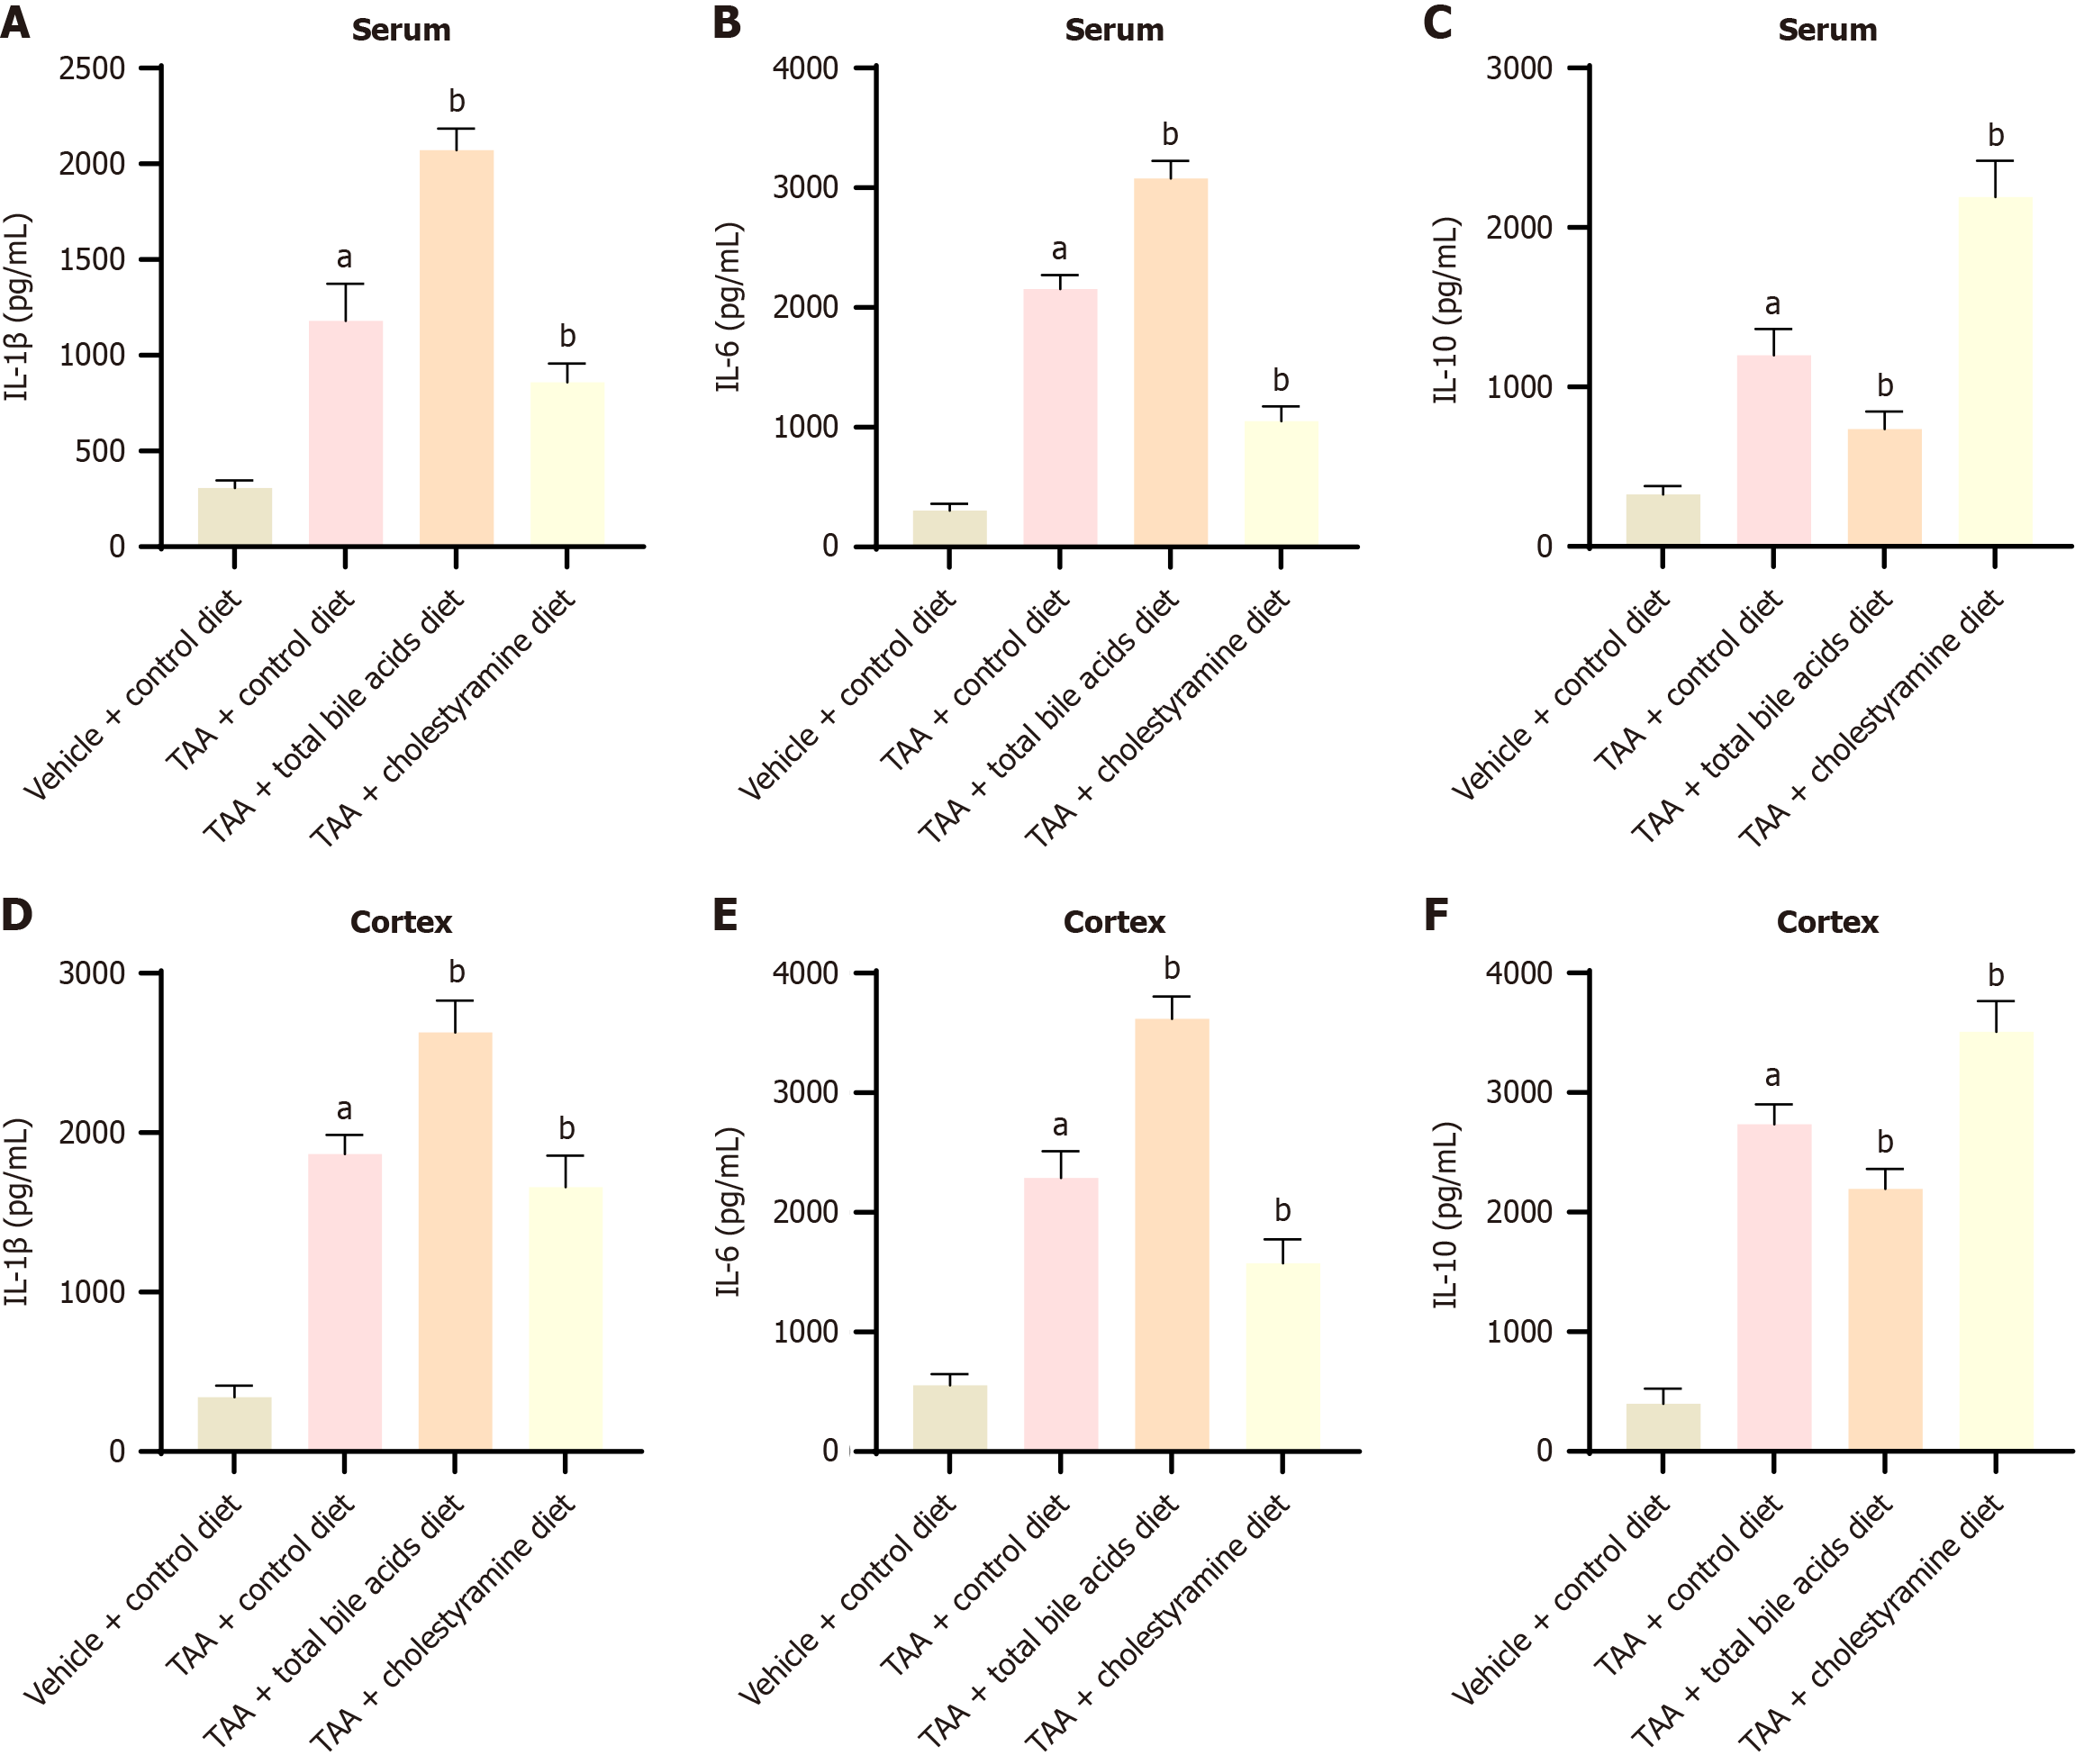
Figure 4 Comparison of serum and cerebral cortex neuroinflammatory factors in each group (mean ± SD, n = 10).
A-C: The content comparison of interleukin-1β (IL-1β), IL-6, and IL-10 in serum of each group; D-F: Compares IL-1β, IL-6, and IL-10 in the cerebral cortex. aP < 0.05 compared with vehicle + control diet group; bP < 0.05 compared with thioacetamide group. IL: Interleukin; TAA: Thioacetamide.
- Citation: Ren C, Cha L, Huang SY, Bai GH, Li JH, Xiong X, Feng YX, Feng DP, Gao L, Li JY. Dysregulation of bile acid signal transduction causes neurological dysfunction in cirrhosis rats. World J Hepatol 2025; 17(3): 101340
- URL: https://www.wjgnet.com/1948-5182/full/v17/i3/101340.htm
- DOI: https://dx.doi.org/10.4254/wjh.v17.i3.101340


