Copyright
©The Author(s) 2025.
World J Hepatol. Feb 27, 2025; 17(2): 99046
Published online Feb 27, 2025. doi: 10.4254/wjh.v17.i2.99046
Published online Feb 27, 2025. doi: 10.4254/wjh.v17.i2.99046
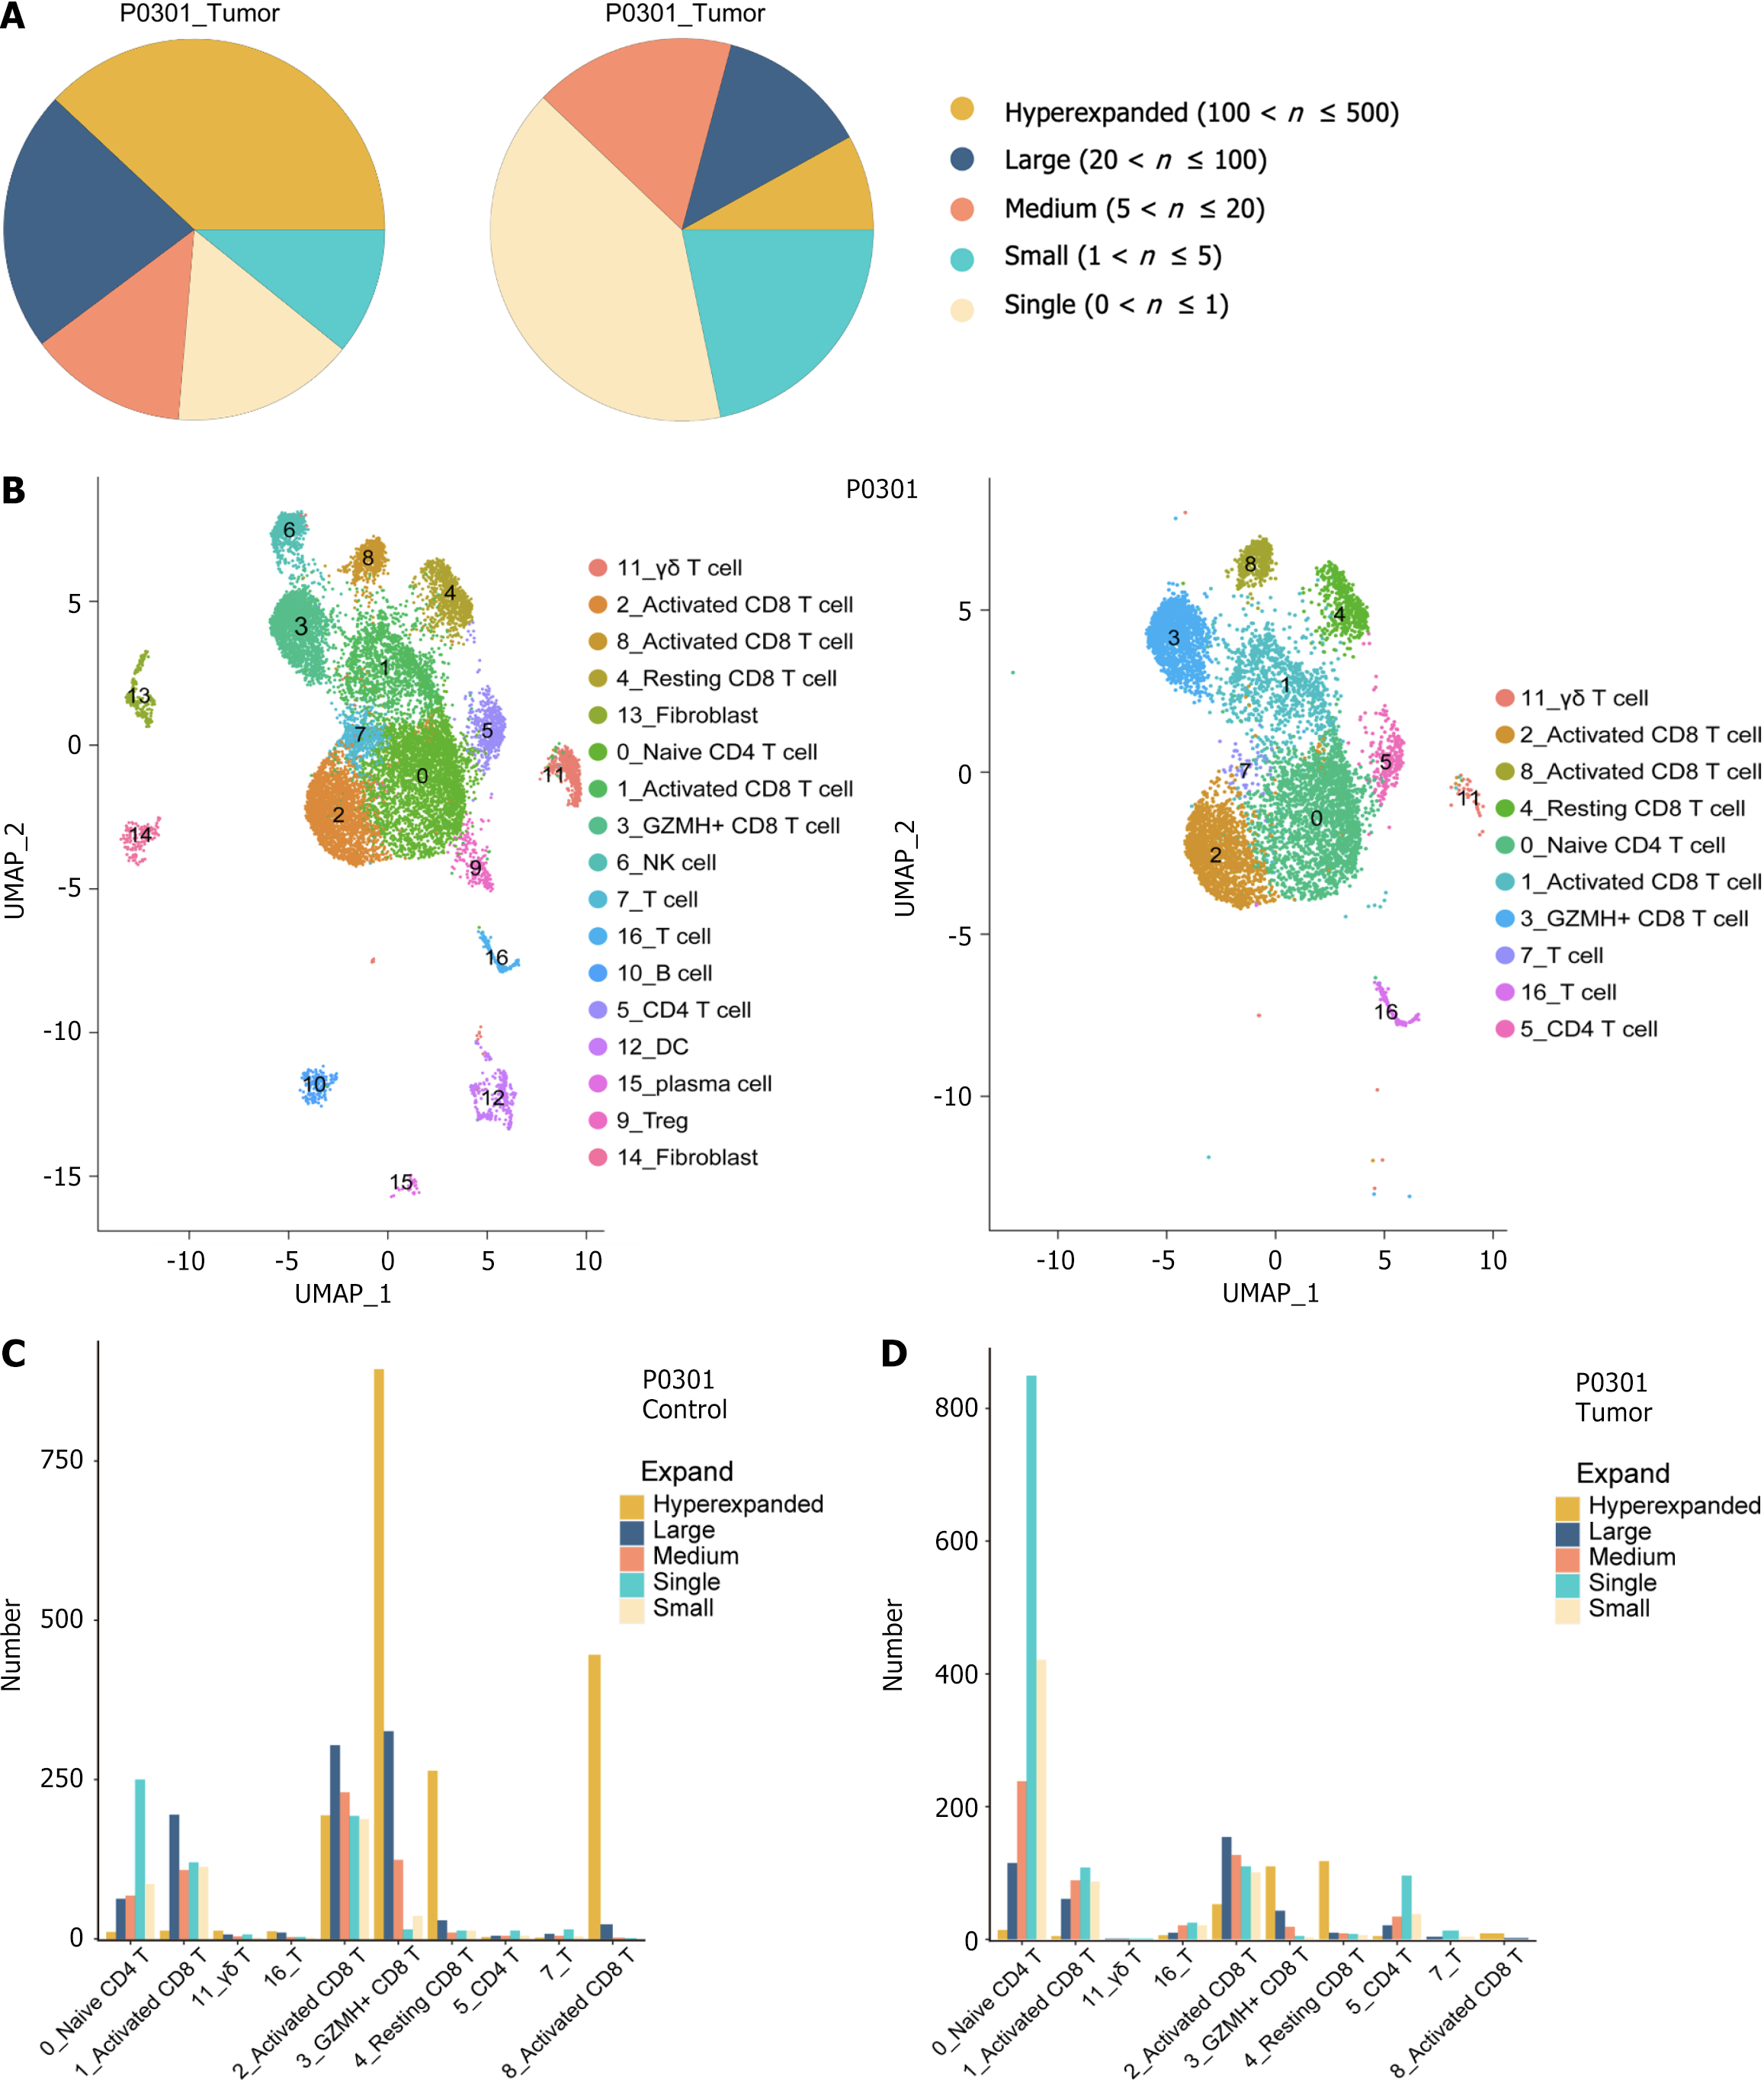
Figure 6 Analysis of T-cell receptor distribution and clonality in hepatocellular carcinoma patients.
A: Sectoral graph showing the extent of T-cell receptor (TCR) clone amplification in hepatocellular carcinoma patients. The different colors correspond to each of the five TCR clone amplification groups; B: Uniform manifold approximation and projections clustering map of T cells generated by combining TCR expression data; C and D: The expansion levels of five different types of TCR amplification groups in each cell subtype of P0301 control and tumor.
- Citation: Gu XY, Gu SL, Chen ZY, Tong JL, Li XY, Dong H, Zhang CY, Qian WX, Ma XC, Yi CH, Yi YX. Uncovering immune cell heterogeneity in hepatocellular carcinoma by combining single-cell RNA sequencing with T-cell receptor sequencing. World J Hepatol 2025; 17(2): 99046
- URL: https://www.wjgnet.com/1948-5182/full/v17/i2/99046.htm
- DOI: https://dx.doi.org/10.4254/wjh.v17.i2.99046


