Copyright
©The Author(s) 2025.
World J Hepatol. Feb 27, 2025; 17(2): 99046
Published online Feb 27, 2025. doi: 10.4254/wjh.v17.i2.99046
Published online Feb 27, 2025. doi: 10.4254/wjh.v17.i2.99046
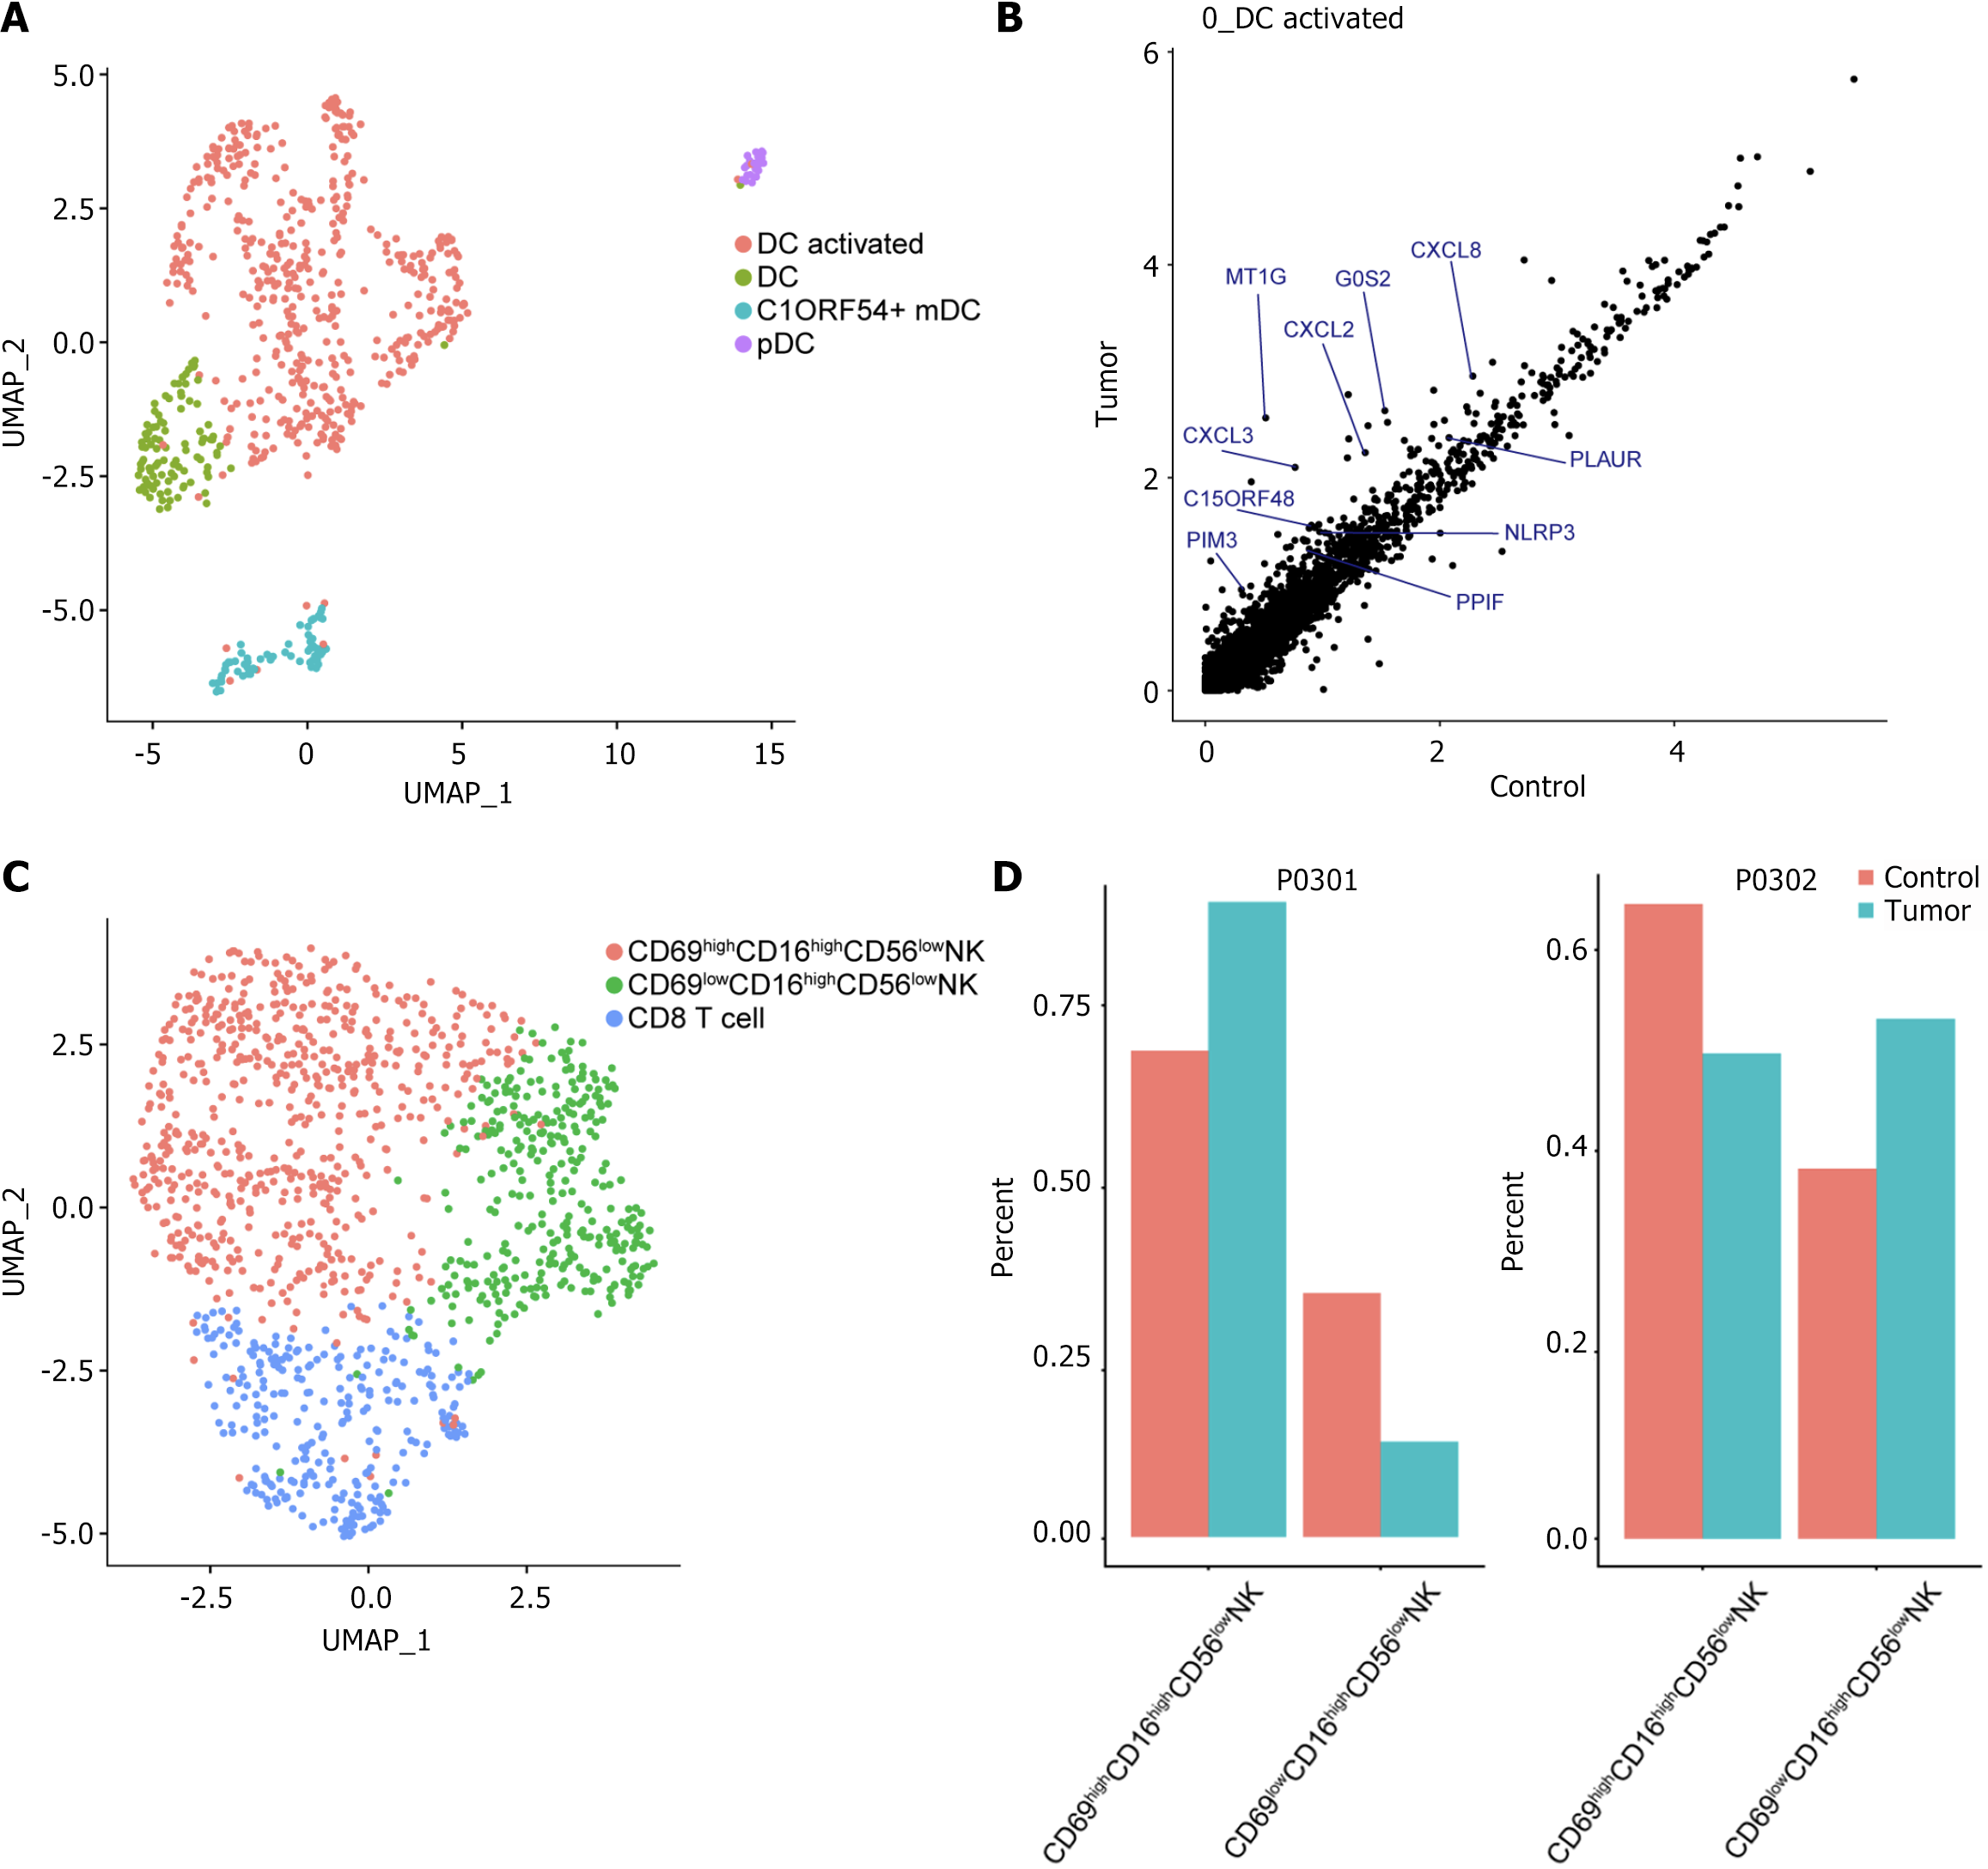
Figure 5 Single-cell immune landscape of dendritic cells and natural killer cells.
A: Uniform manifold approximation and projections plots showing dendritic cell subpopulations; B: Scatter plot of differentially expressed genes showing genes highly expressed in activated 0_DC tumors. Each dot represents a gene; C: Uniform manifold approximation and projections plots showing subpopulations of natural killer cells; D: Histogram showing the percentage of natural killer cells from different sources of tissues. UMAP: Uniform manifold approximation and projections; DC: Dendritic cell; C1ORF54: Chromosome 1 open reading frame 54; PDC: Plasmacytoid dendritic cell; NK: Natural killer.
- Citation: Gu XY, Gu SL, Chen ZY, Tong JL, Li XY, Dong H, Zhang CY, Qian WX, Ma XC, Yi CH, Yi YX. Uncovering immune cell heterogeneity in hepatocellular carcinoma by combining single-cell RNA sequencing with T-cell receptor sequencing. World J Hepatol 2025; 17(2): 99046
- URL: https://www.wjgnet.com/1948-5182/full/v17/i2/99046.htm
- DOI: https://dx.doi.org/10.4254/wjh.v17.i2.99046


