Copyright
©The Author(s) 2025.
World J Hepatol. Feb 27, 2025; 17(2): 99046
Published online Feb 27, 2025. doi: 10.4254/wjh.v17.i2.99046
Published online Feb 27, 2025. doi: 10.4254/wjh.v17.i2.99046
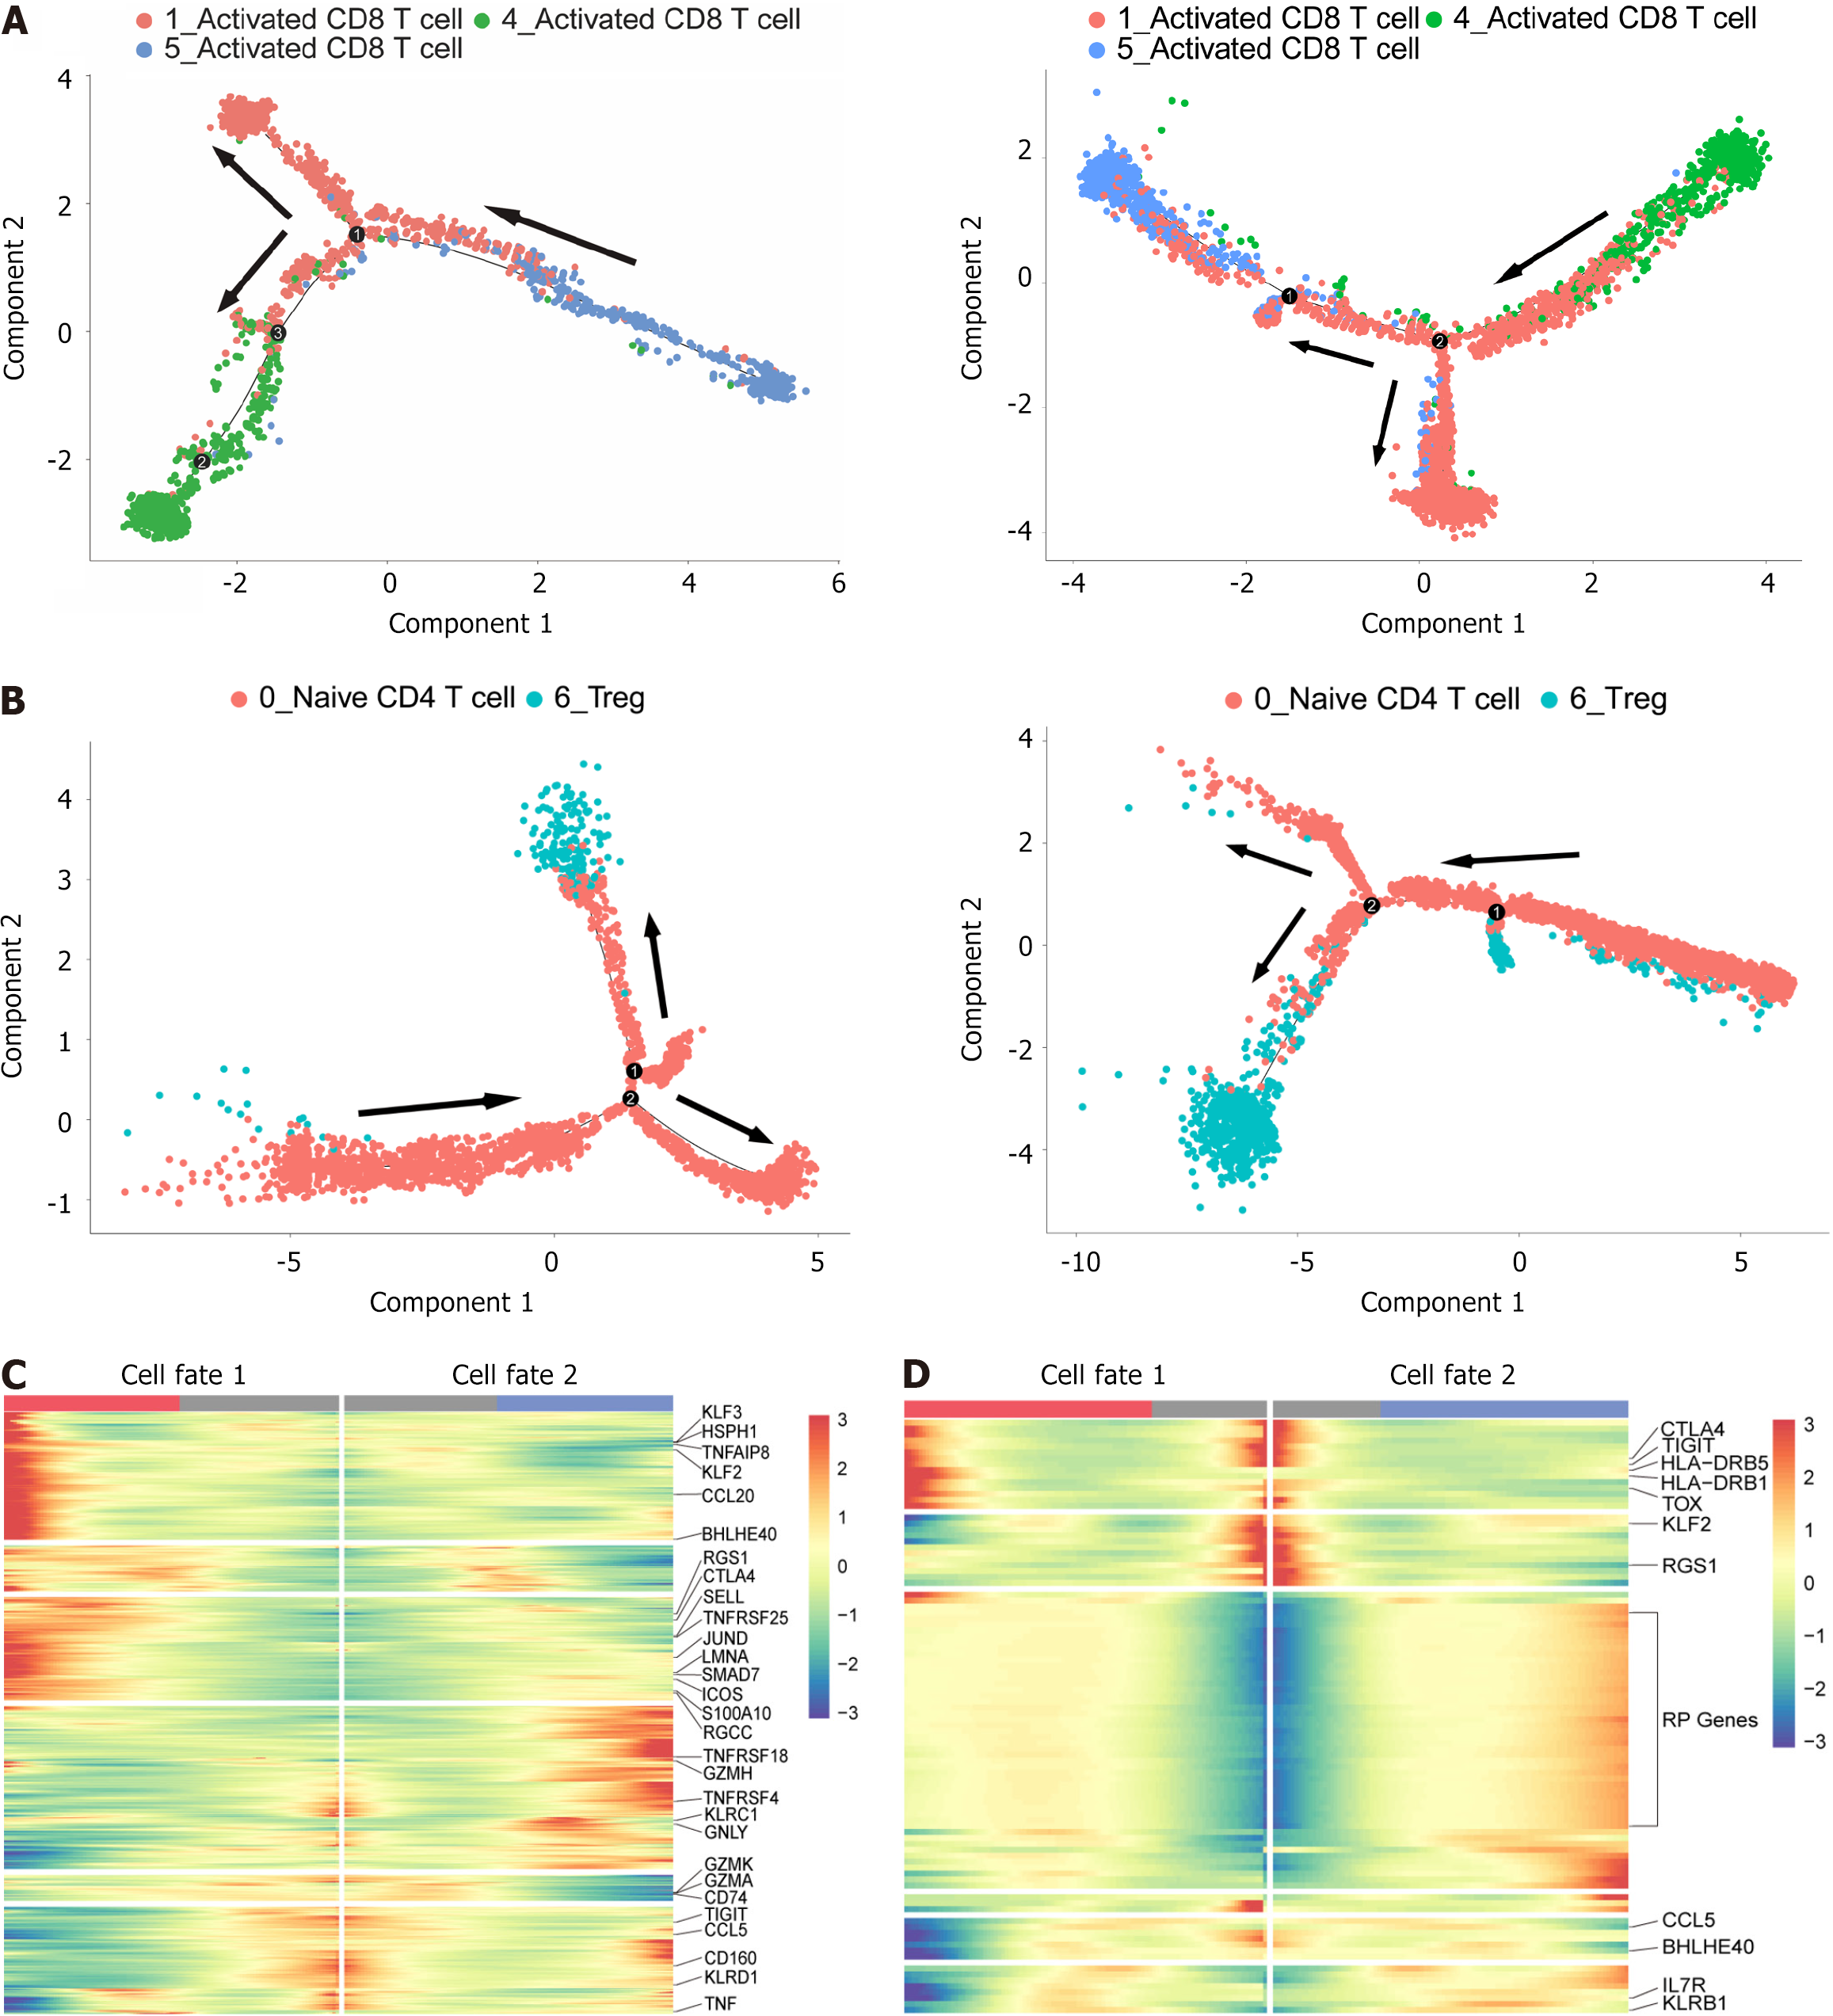
Figure 3 Analysis of the development trajectories of the CD8+ T and CD4+ T-cell subsets.
A: Schematic diagram of the pseudotime trajectory of CD8+ T-cell subpopulations at P0301 (left) and P0302 (right). Each dot corresponds to a single cell, and each color represents a T-cell cluster; B: The same trajectory analysis was applied to CD4+ T cells; C: Heatmap of differential gene expression using branch point expression analysis comparing different cell fates of CD8+ T cells at P0301. Each row represents a gene, and the column represents a total of 100 bins that divide the pseudotime value from start to finish; D: Branch point expression analysis of the same CD4+ T cells in P0301.
- Citation: Gu XY, Gu SL, Chen ZY, Tong JL, Li XY, Dong H, Zhang CY, Qian WX, Ma XC, Yi CH, Yi YX. Uncovering immune cell heterogeneity in hepatocellular carcinoma by combining single-cell RNA sequencing with T-cell receptor sequencing. World J Hepatol 2025; 17(2): 99046
- URL: https://www.wjgnet.com/1948-5182/full/v17/i2/99046.htm
- DOI: https://dx.doi.org/10.4254/wjh.v17.i2.99046


