Copyright
©The Author(s) 2025.
World J Hepatol. Feb 27, 2025; 17(2): 96506
Published online Feb 27, 2025. doi: 10.4254/wjh.v17.i2.96506
Published online Feb 27, 2025. doi: 10.4254/wjh.v17.i2.96506
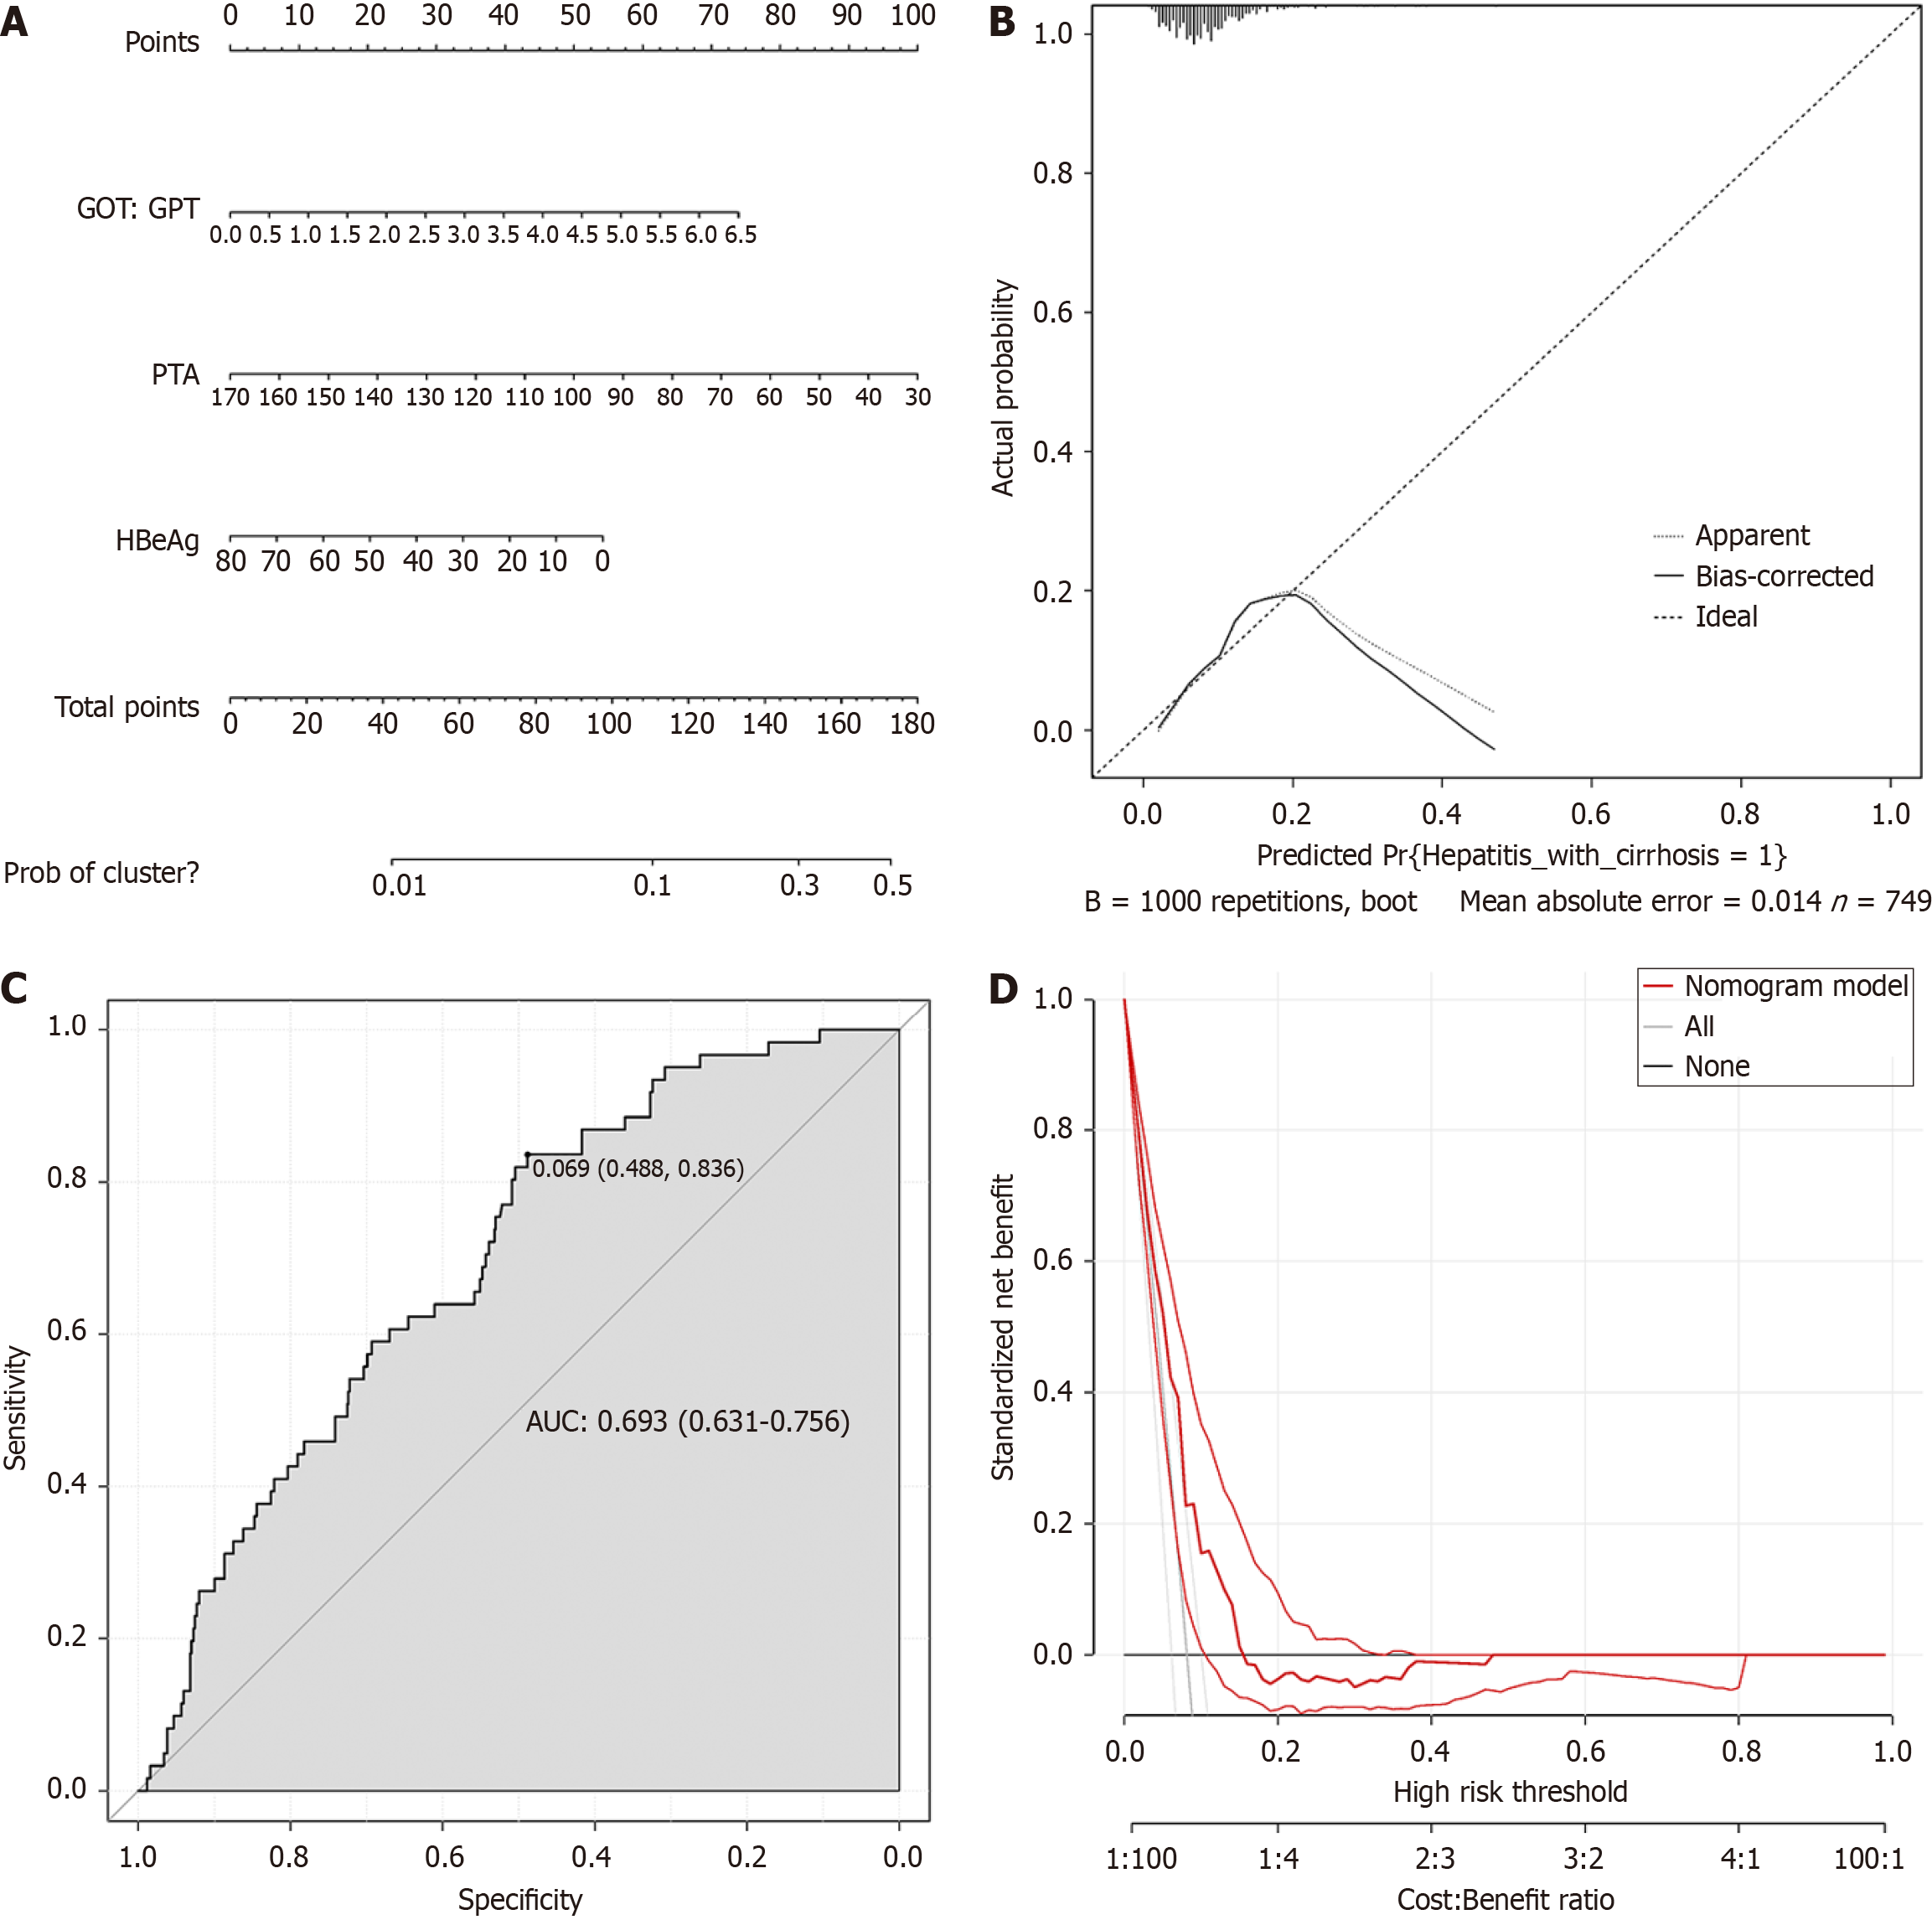
Figure 1 Establishment of a nomogram model for predicting the occurrence of hepatitis cirrhosis.
A: Nomogram; B: Calibration curve of modeling queue; C: Receiver operating characteristic curve of modeling queue; D: Modeling queue decision analysis curve. PTA: Prothrombin activity; GOT: Aspartate aminotransferase; GPT: Alanine aminotransferase; HBeAg: Hepatitis B E antigen; AUC: Aera under curve.
- Citation: Huang YS, Gao W, Sun AJ, Pu CW, Xu SS. Clinical characteristics of patients with hepatitis and cirrhosis and the construction of a prediction model. World J Hepatol 2025; 17(2): 96506
- URL: https://www.wjgnet.com/1948-5182/full/v17/i2/96506.htm
- DOI: https://dx.doi.org/10.4254/wjh.v17.i2.96506


