Copyright
©The Author(s) 2025.
World J Hepatol. Feb 27, 2025; 17(2): 103016
Published online Feb 27, 2025. doi: 10.4254/wjh.v17.i2.103016
Published online Feb 27, 2025. doi: 10.4254/wjh.v17.i2.103016
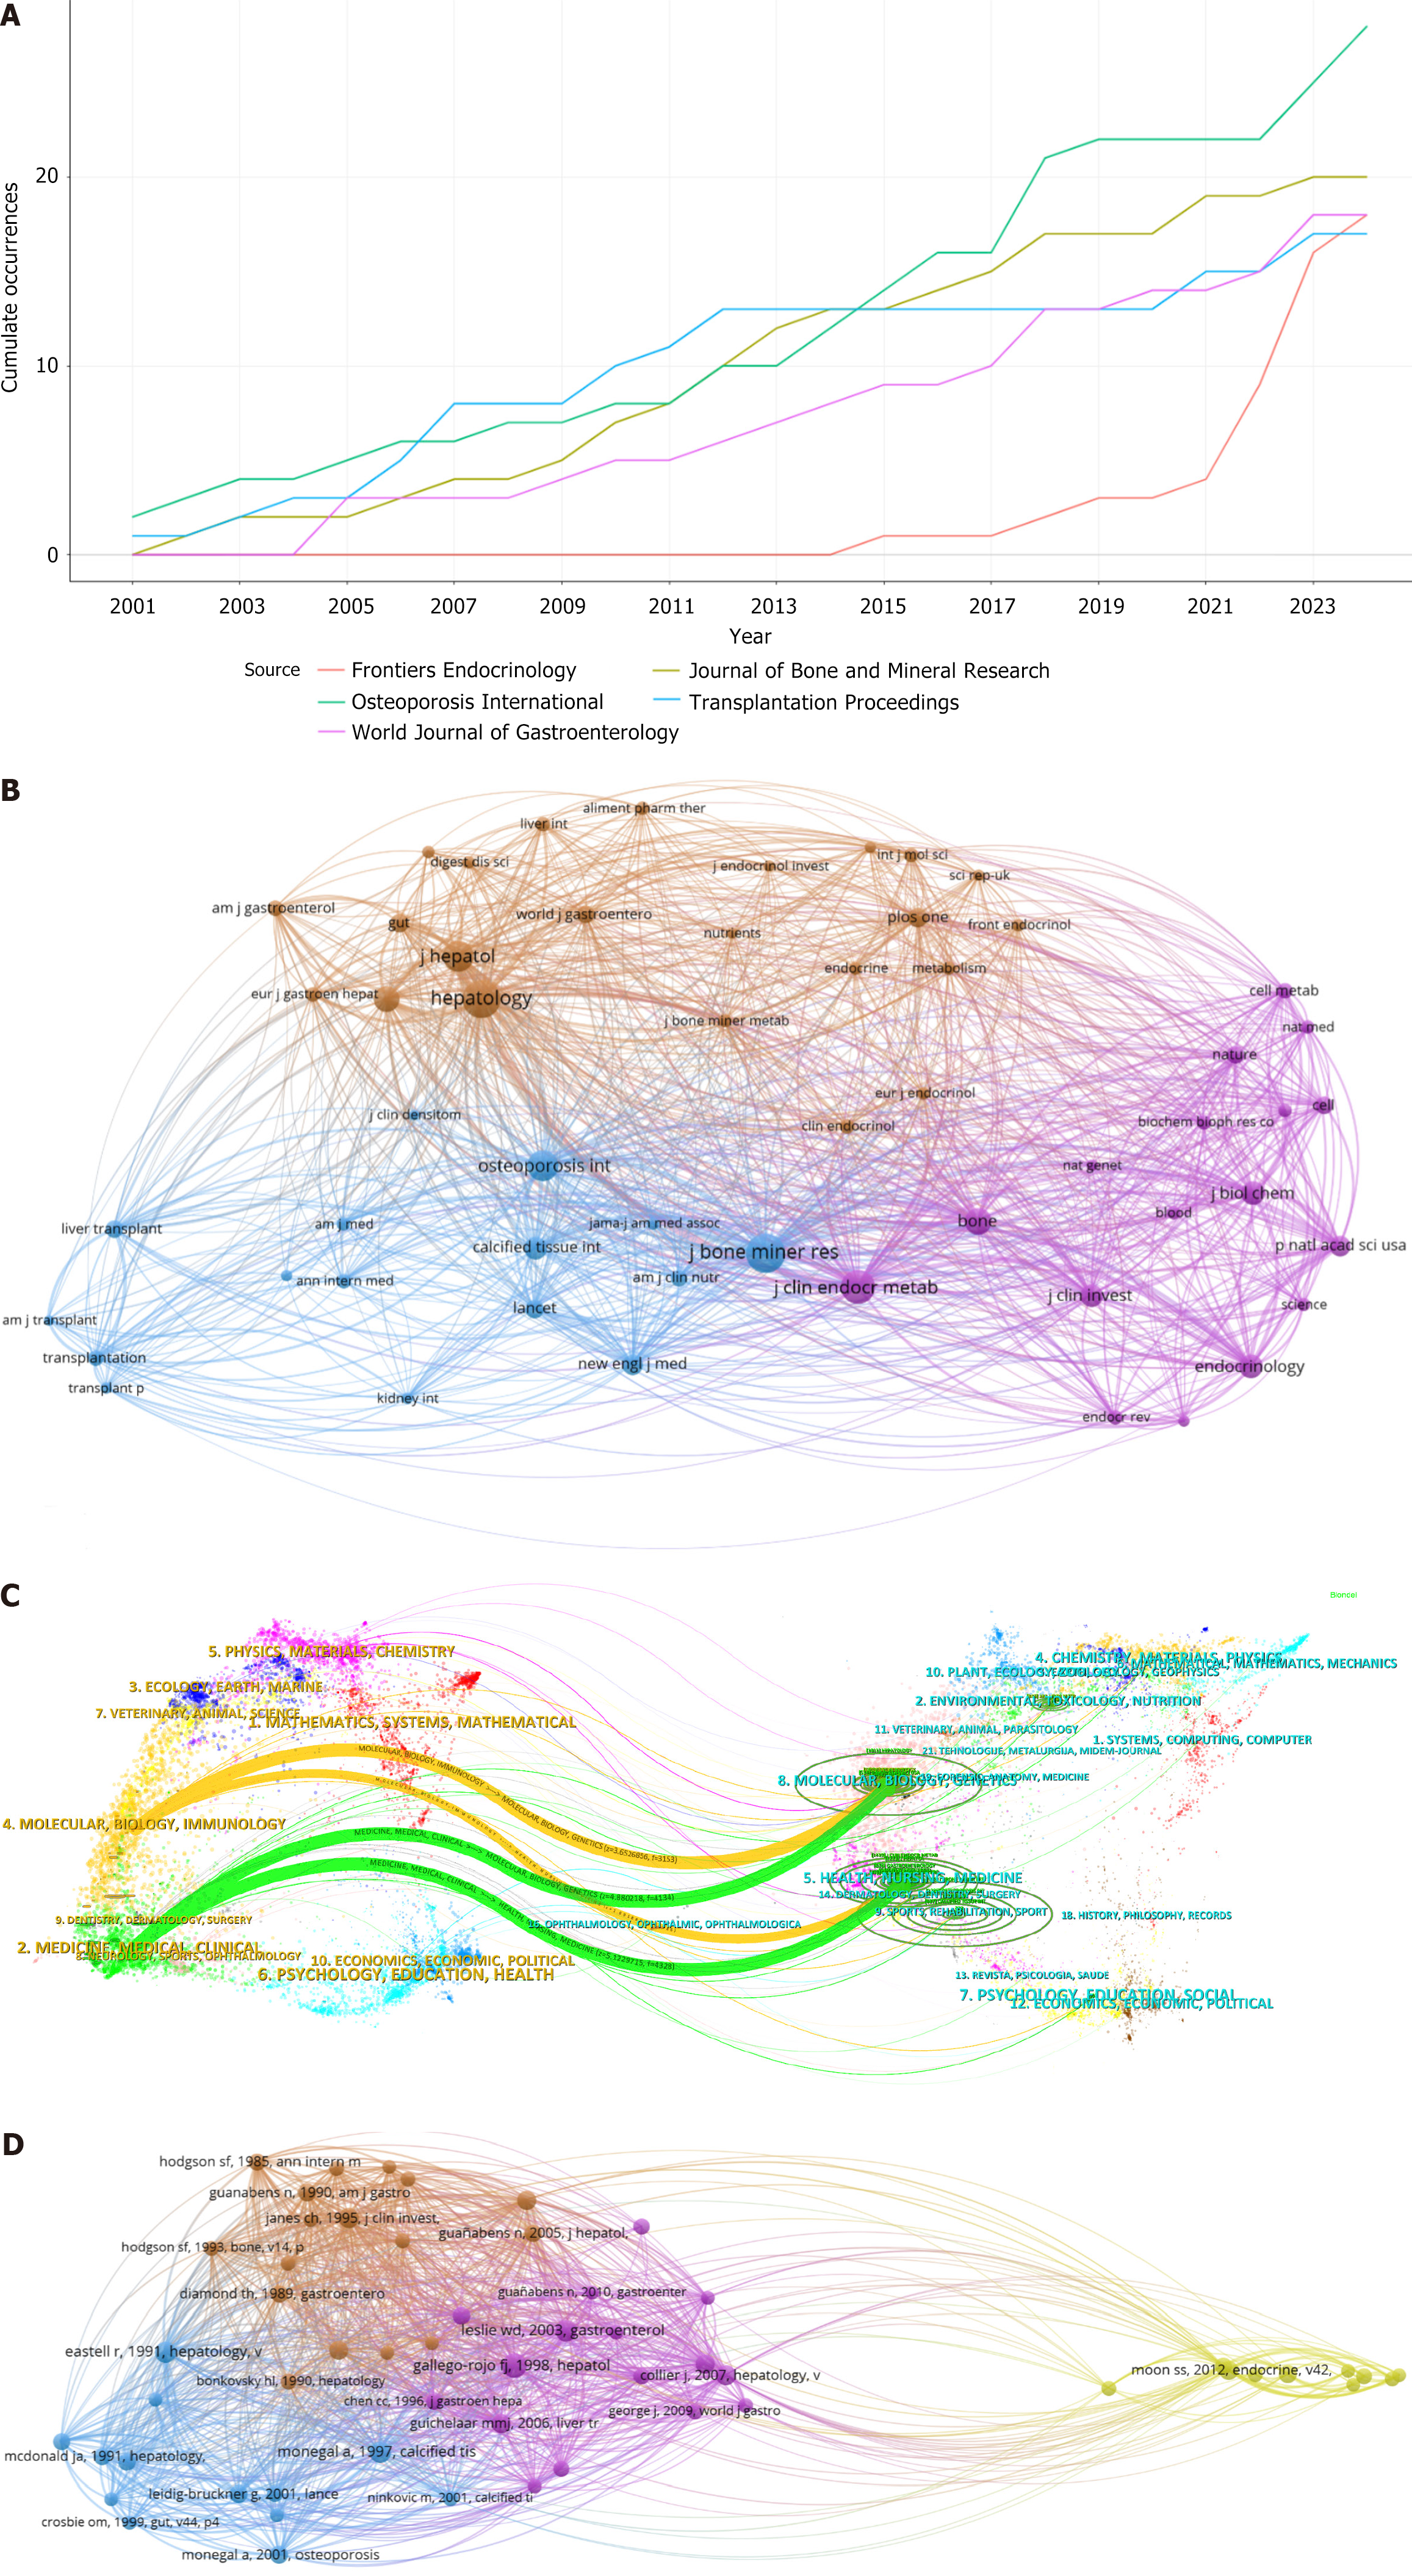
Figure 4 Analysis of journal and the co-citation network of articles.
A: Line chart of journal publications; B: The co-citation network of journals. The size of the spheres reflects the frequency of citations to journals, with different colors representing distinct clusters. The lines represent the co-citation intensity of journals. The threshold is 30; C: Dual-map overlay of articles related to the bone-liver axis. The left side represents the citing literature and the right side represents the cited literature; D: Each sphere represents one article, and the lines between the spheres represent the co-citation of two articles. Different colors represent different clusters. The threshold is 30.
- Citation: Zhang WJ, Xu XP, Song XH, Zhang ZR, Zhang XR, Yang B, Tao ZB, Zhang Z, Zhou XH. Liver function linked to bone health: A bibliometric of the liver-bone axis. World J Hepatol 2025; 17(2): 103016
- URL: https://www.wjgnet.com/1948-5182/full/v17/i2/103016.htm
- DOI: https://dx.doi.org/10.4254/wjh.v17.i2.103016


