Copyright
©The Author(s) 2025.
World J Hepatol. Feb 27, 2025; 17(2): 103016
Published online Feb 27, 2025. doi: 10.4254/wjh.v17.i2.103016
Published online Feb 27, 2025. doi: 10.4254/wjh.v17.i2.103016
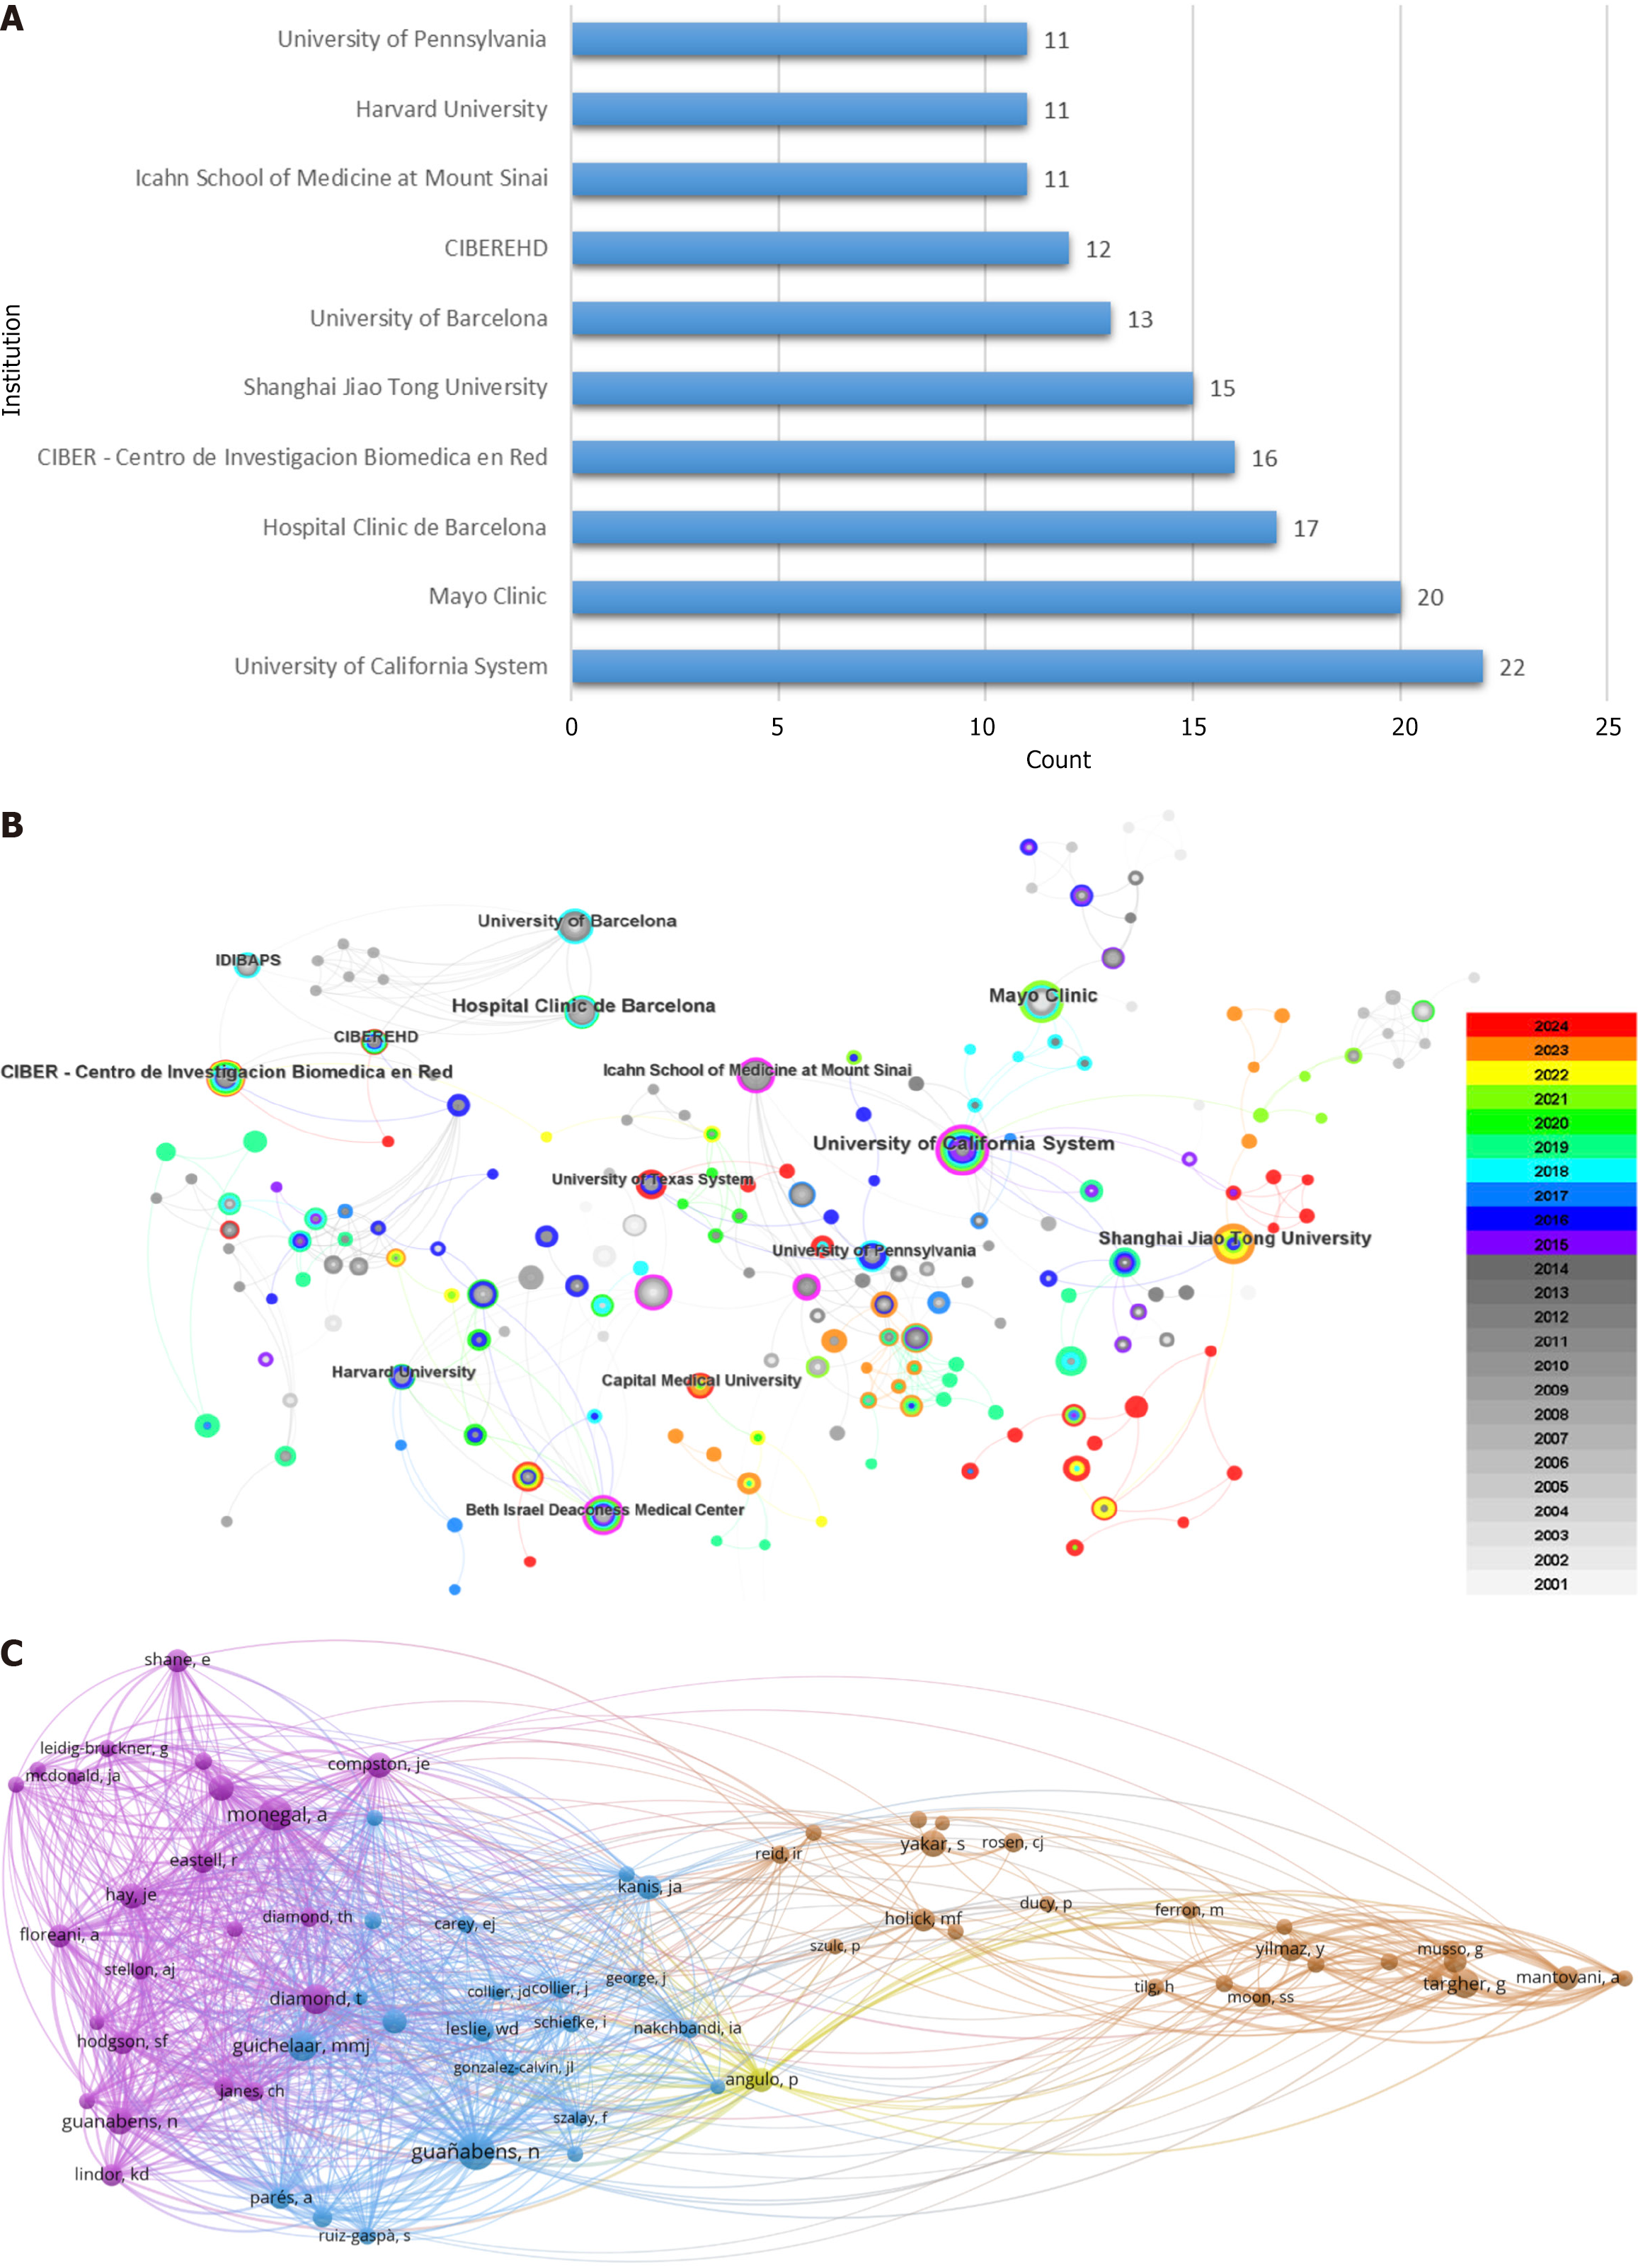
Figure 3 Analysis of institutions and authors.
A: Bar chart of the top ten issuing institutions; B: Network diagram of institutional collaborations. The thickness of the line reflects the strength of the collaboration; C: The co-citation network of authors. Each sphere represents one author, and the lines between the spheres represent two co-cited authors. Different colors represent different clusters. The threshold is 40.
- Citation: Zhang WJ, Xu XP, Song XH, Zhang ZR, Zhang XR, Yang B, Tao ZB, Zhang Z, Zhou XH. Liver function linked to bone health: A bibliometric of the liver-bone axis. World J Hepatol 2025; 17(2): 103016
- URL: https://www.wjgnet.com/1948-5182/full/v17/i2/103016.htm
- DOI: https://dx.doi.org/10.4254/wjh.v17.i2.103016


