Copyright
©The Author(s) 2025.
World J Hepatol. Feb 27, 2025; 17(2): 103016
Published online Feb 27, 2025. doi: 10.4254/wjh.v17.i2.103016
Published online Feb 27, 2025. doi: 10.4254/wjh.v17.i2.103016
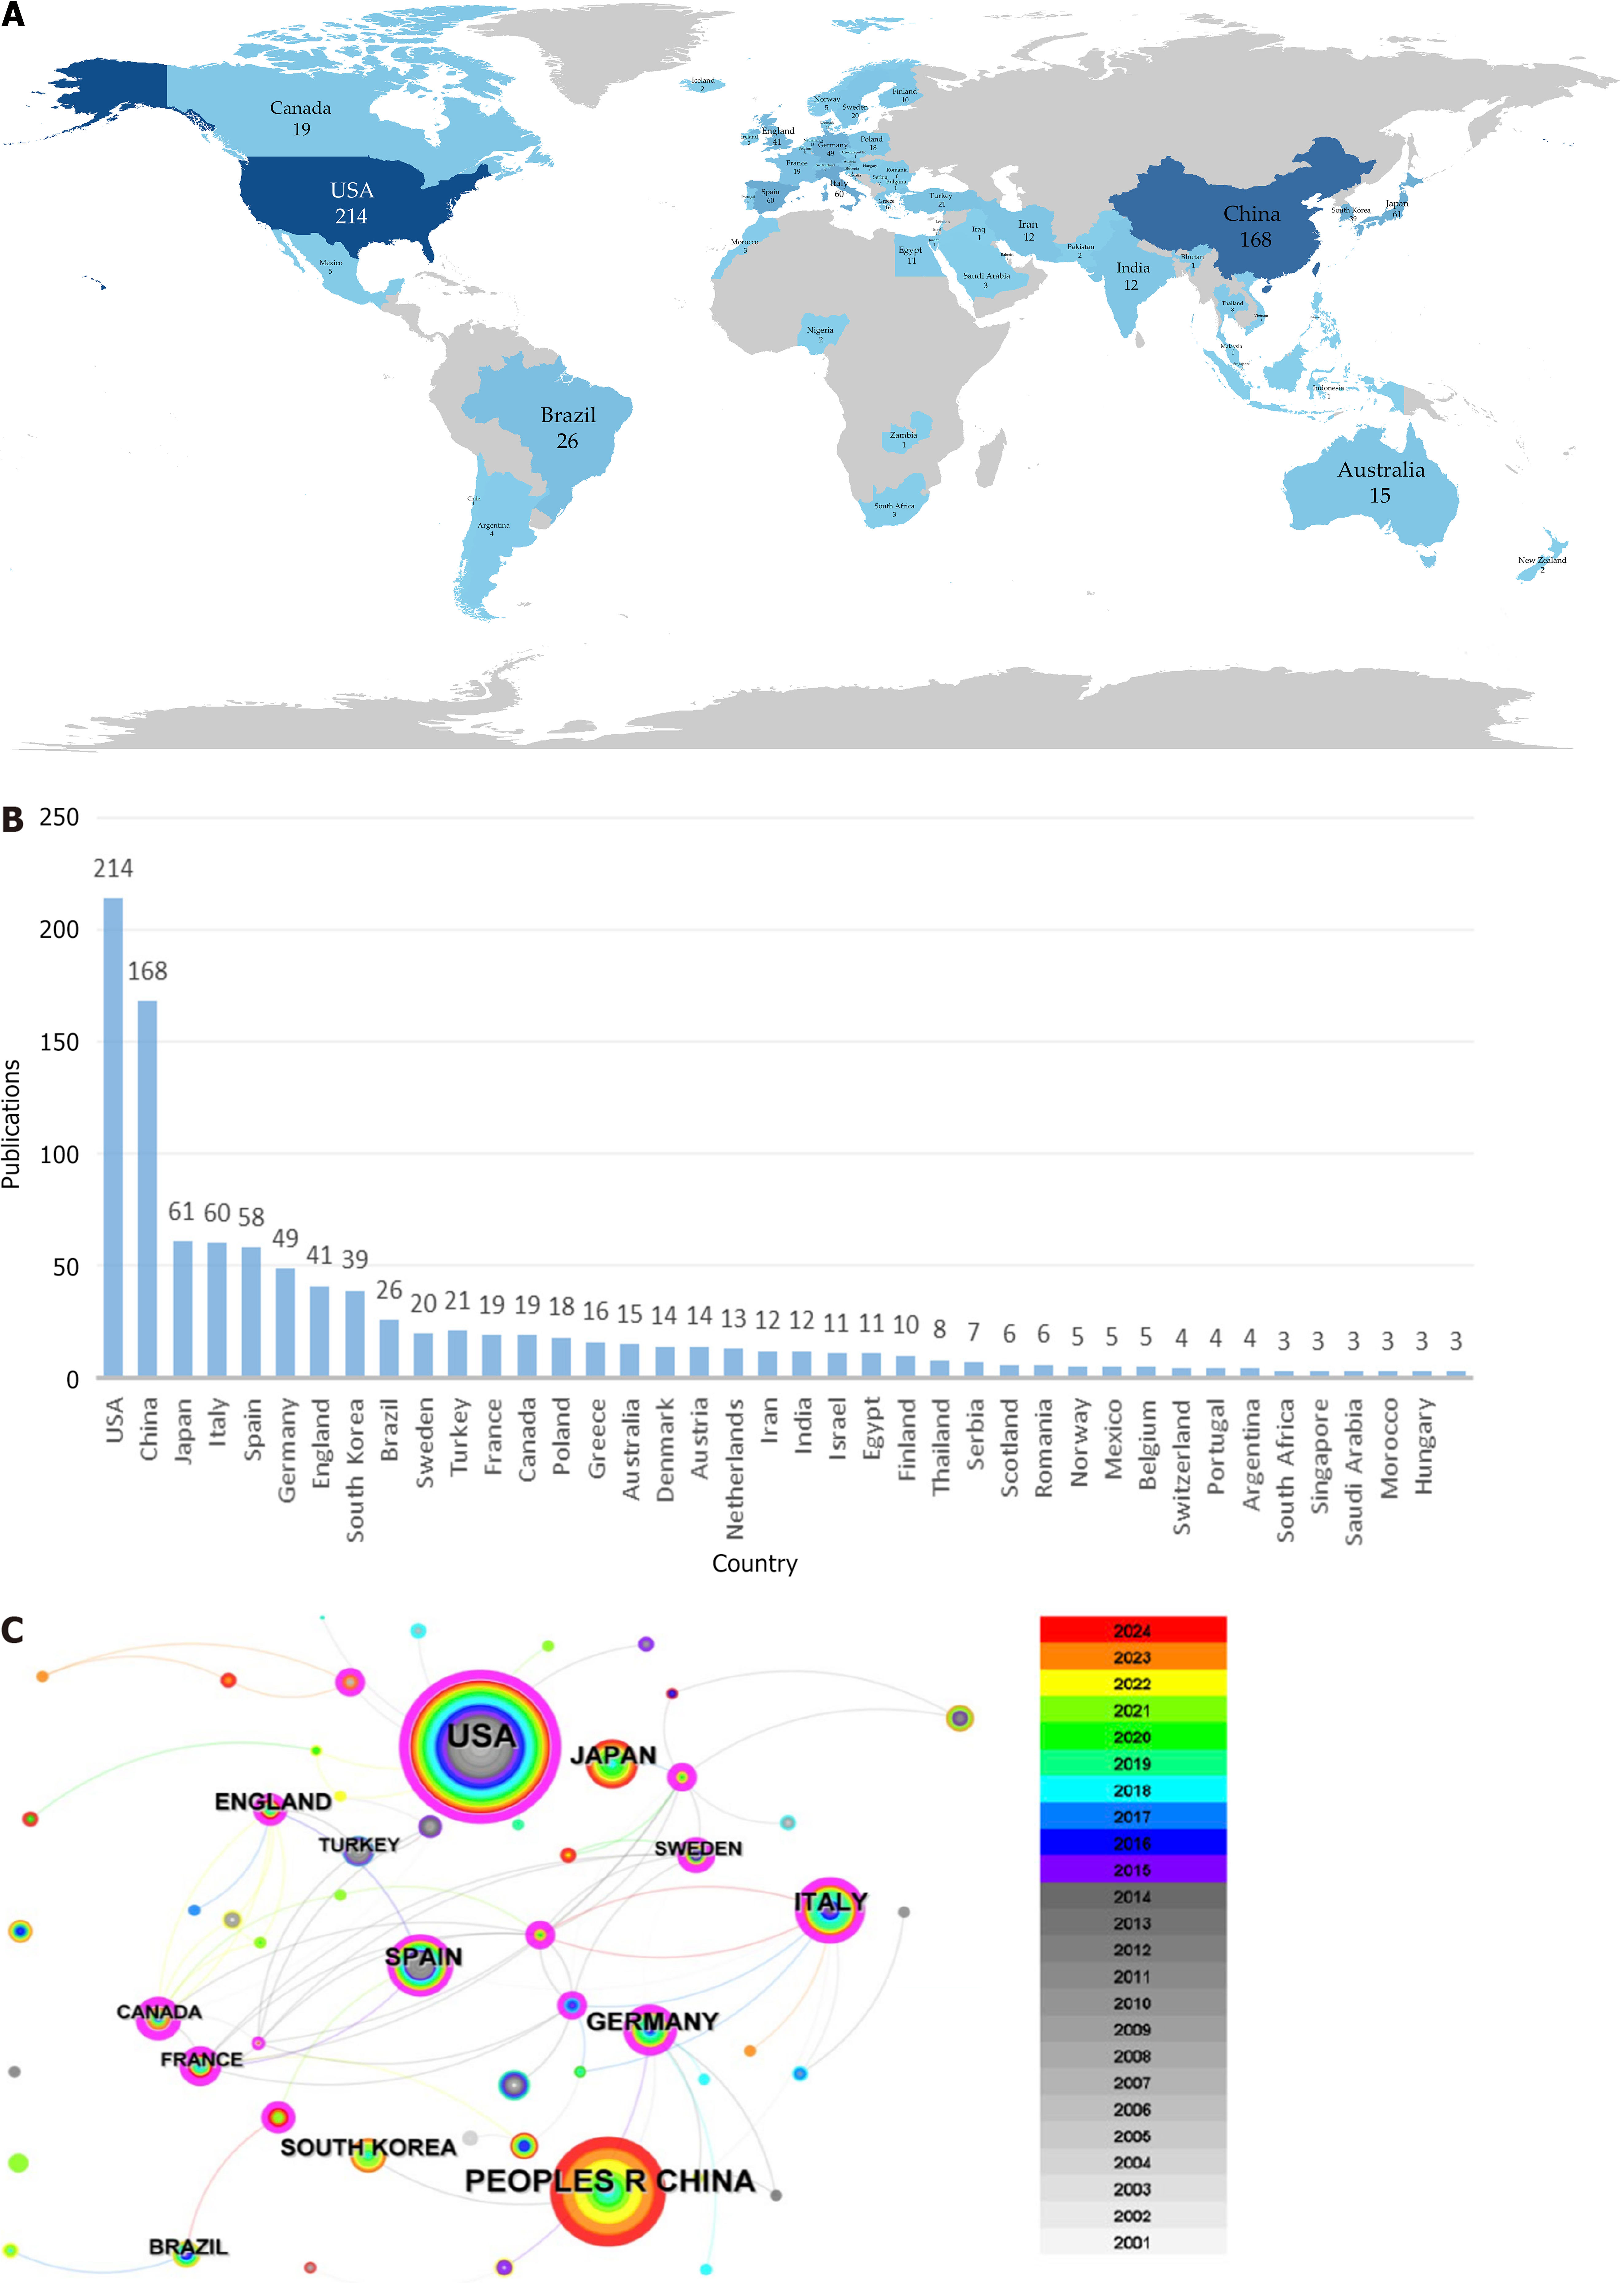
Figure 2 Analysis of country.
A: Map of the world with national publications; B: Bar chart of national publications; C: Country collaboration network. Each circle represents a country and the lines between the circles represent cooperation between countries, the thicker the line the more cooperation. Different colored rings represent different publication years, and the size of the ring represents the number of publications. Purple rings represent countries with high centrality.
- Citation: Zhang WJ, Xu XP, Song XH, Zhang ZR, Zhang XR, Yang B, Tao ZB, Zhang Z, Zhou XH. Liver function linked to bone health: A bibliometric of the liver-bone axis. World J Hepatol 2025; 17(2): 103016
- URL: https://www.wjgnet.com/1948-5182/full/v17/i2/103016.htm
- DOI: https://dx.doi.org/10.4254/wjh.v17.i2.103016


