Copyright
©The Author(s) 2025.
World J Hepatol. Feb 27, 2025; 17(2): 100923
Published online Feb 27, 2025. doi: 10.4254/wjh.v17.i2.100923
Published online Feb 27, 2025. doi: 10.4254/wjh.v17.i2.100923
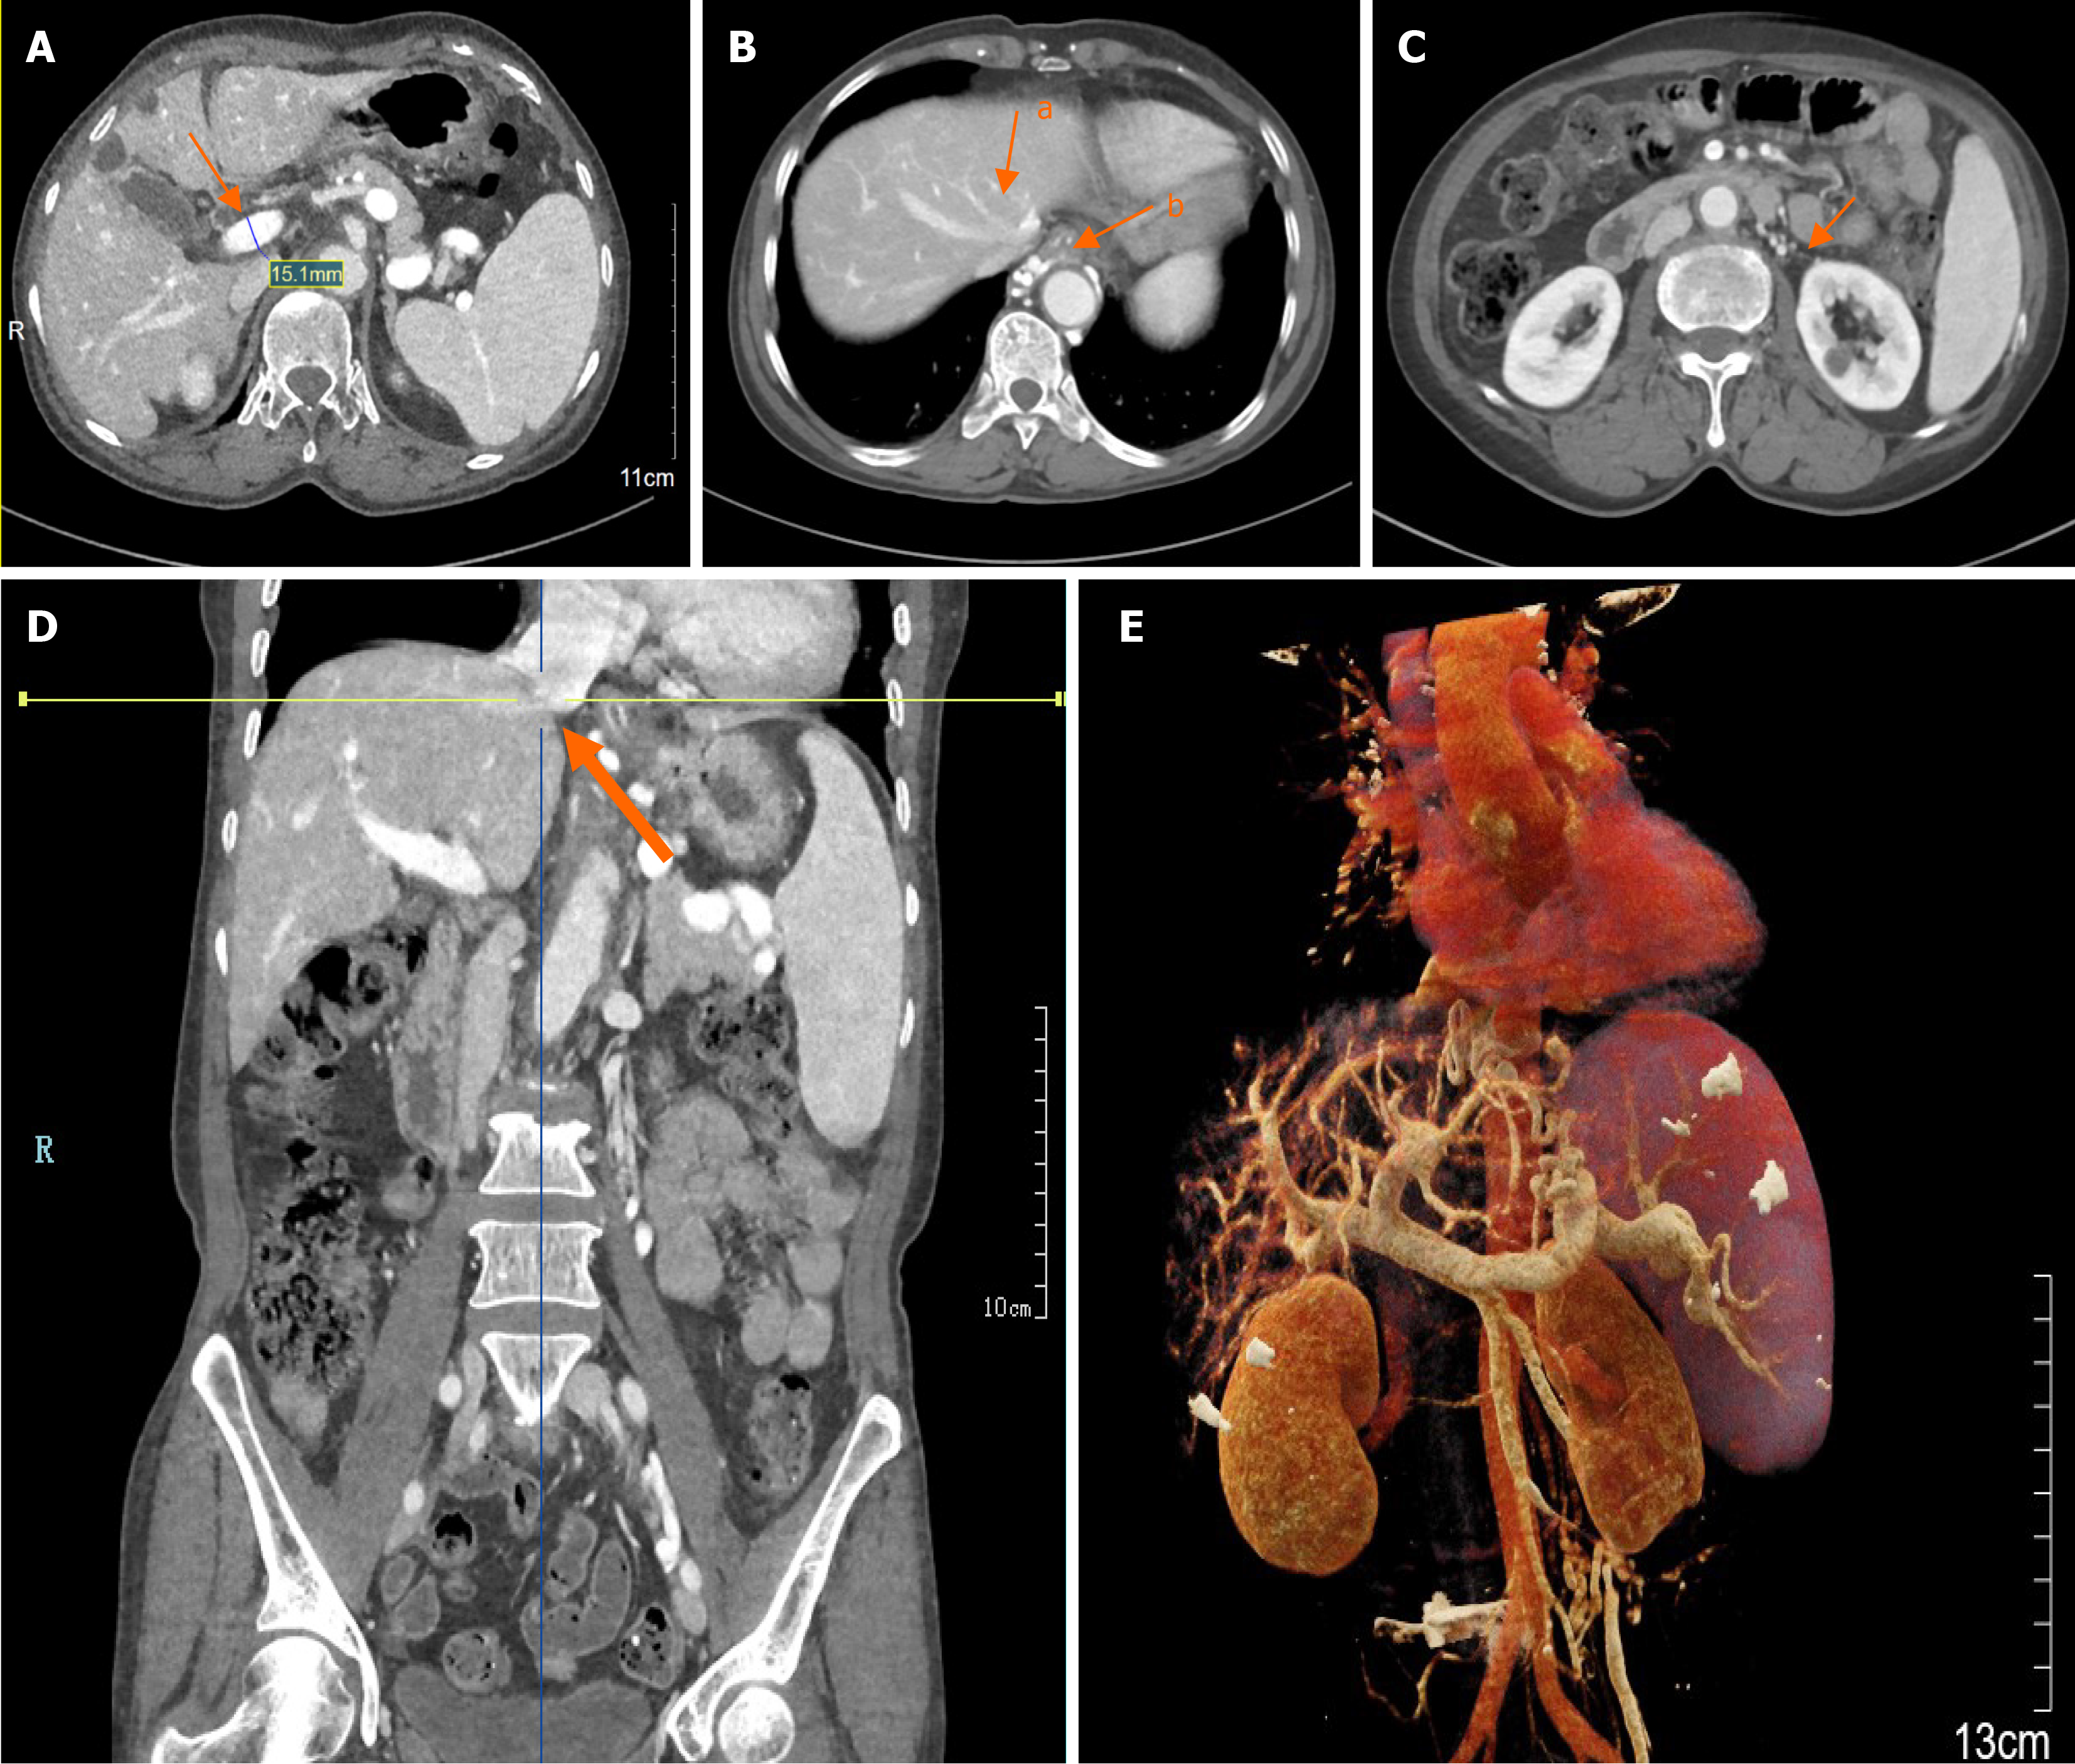
Figure 2 Presentation of portal hypertension on computed tomography.
A: The portal vein is 15.1 mm in diameter and significantly widened; B: Images of the portal venous phase of computed tomography (CT), (arrow a: CT images of the second porta hepatis reveal no obstruction in the secondary portal of the liver. Arrow b: Multiple esophageal varices are observed on enhanced CT); C: The splenorenal shunt is seen in the portal venous phase; therefore, the varicose vein near the cardia was clamped under endoscopic treatment before injection; D: Sagittal screenshot of the second porta hepatis in the portal venous phase of CT; The orange arrow indicates the intersection of the two lines where the hepatic vein joins the inferior vena cava, and there is no obvious obstruction; E: The CT portal vein reconstruction reveals no significant obstructions.
- Citation: Liu XC, Yan HH, Wei W, Du Q. Idiopathic portal hypertension misdiagnosed as hepatitis B cirrhosis: A case report and review of the literature. World J Hepatol 2025; 17(2): 100923
- URL: https://www.wjgnet.com/1948-5182/full/v17/i2/100923.htm
- DOI: https://dx.doi.org/10.4254/wjh.v17.i2.100923


