Copyright
©The Author(s) 2024.
World J Hepatol. Aug 27, 2024; 16(8): 1177-1184
Published online Aug 27, 2024. doi: 10.4254/wjh.v16.i8.1177
Published online Aug 27, 2024. doi: 10.4254/wjh.v16.i8.1177
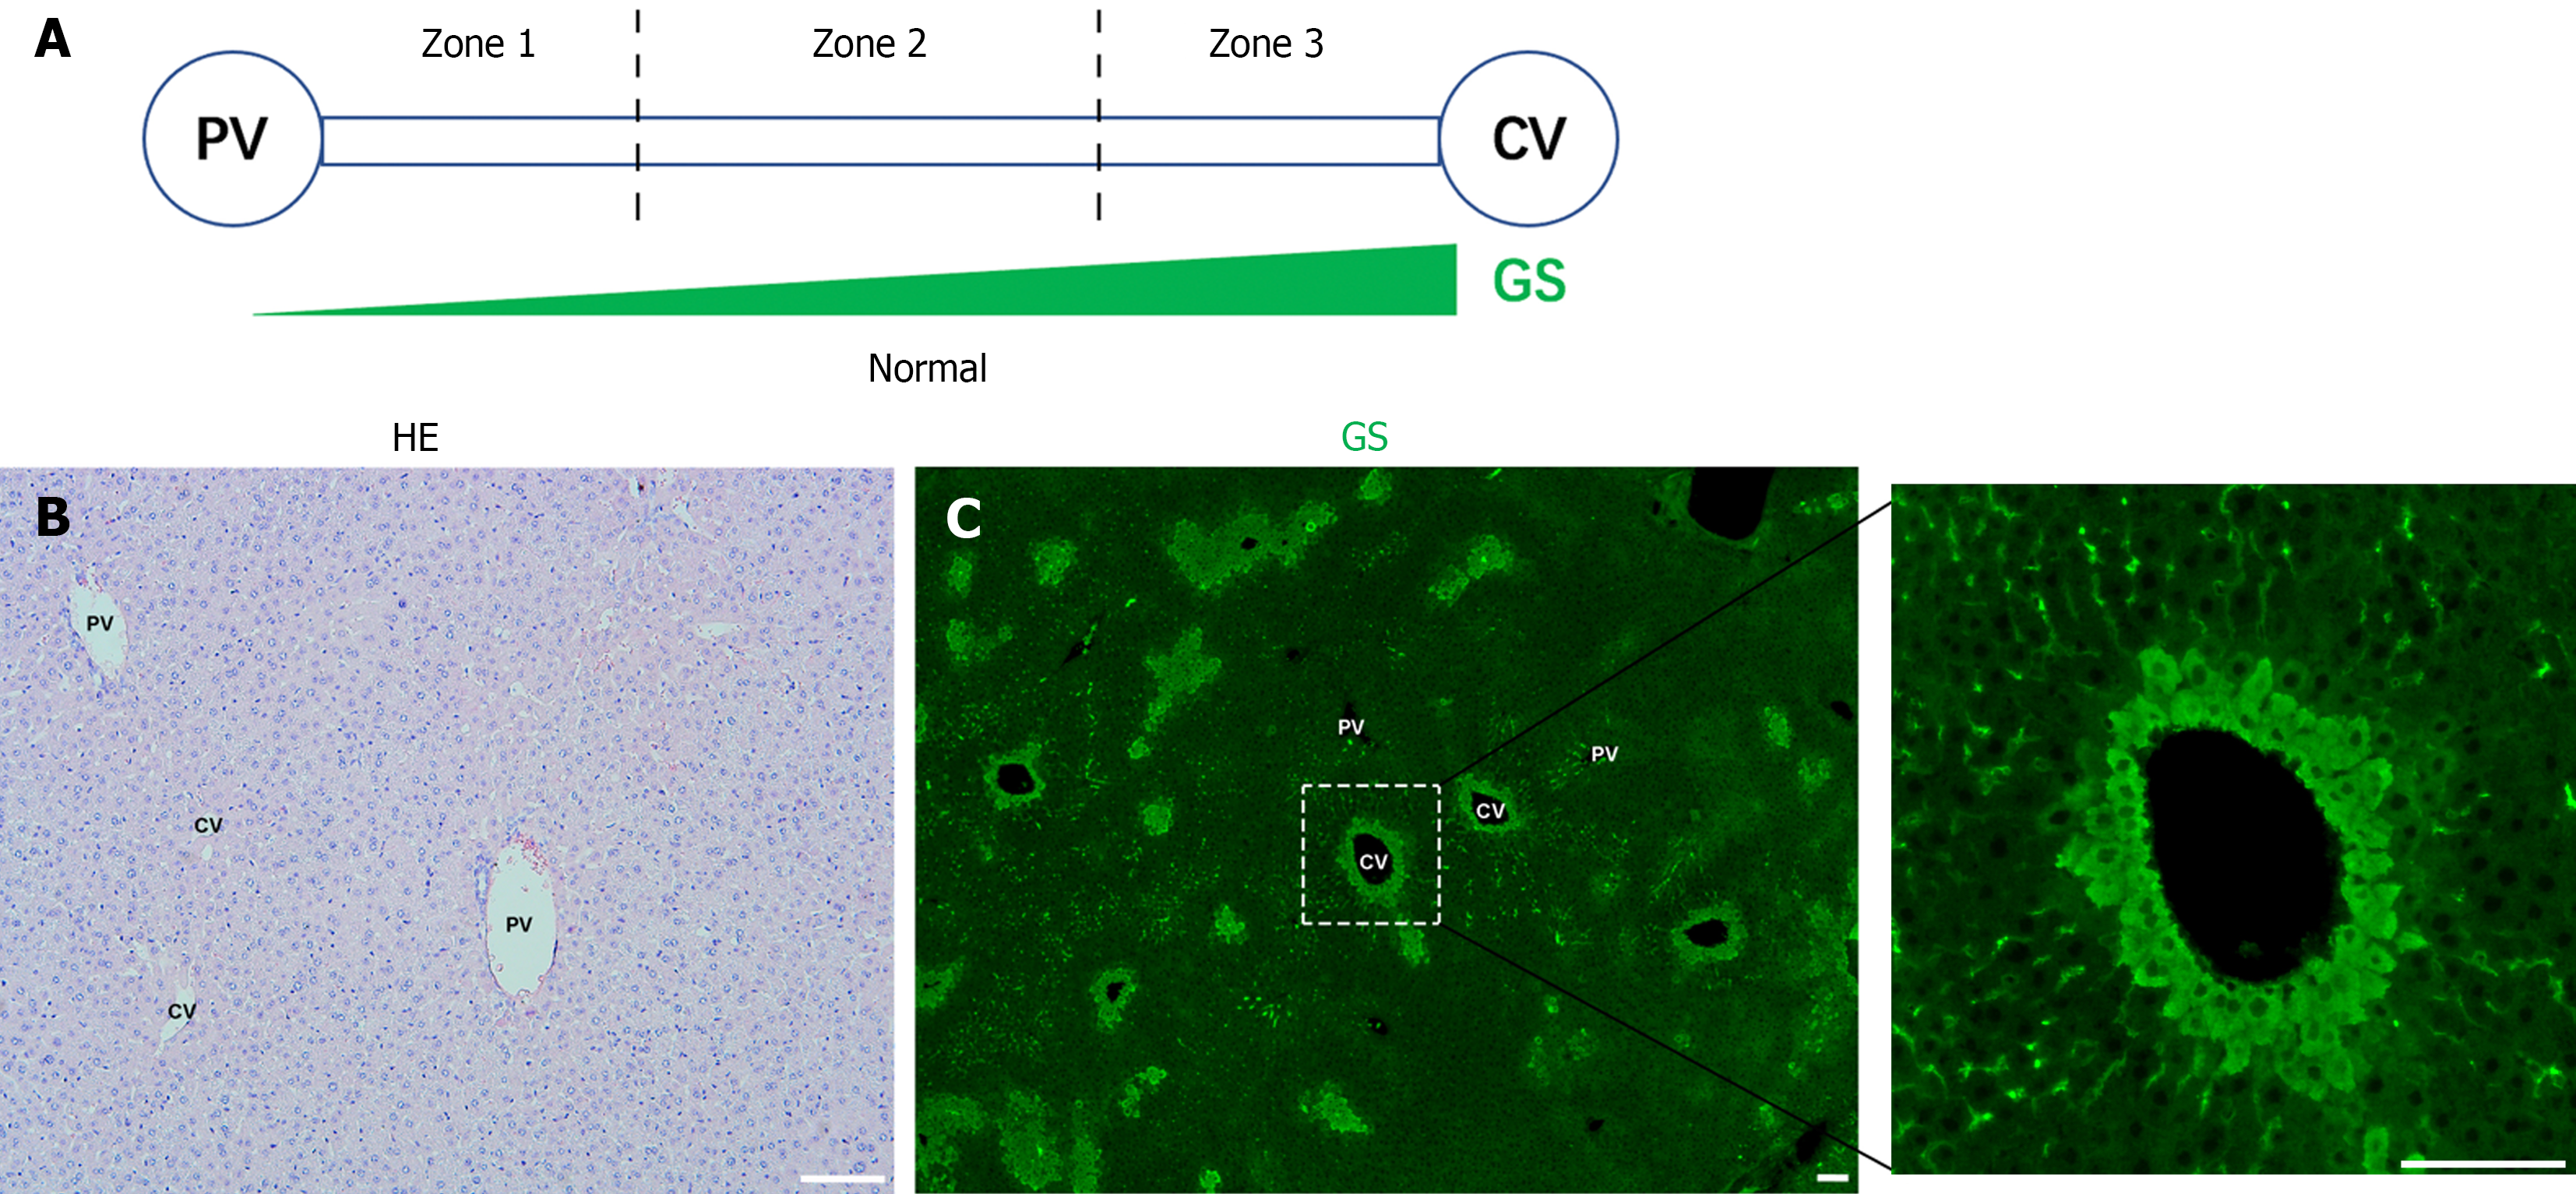
Figure 1 The distribution of glutamine synthetase in normal liver.
A: Schematic illustration of liver zonation; B: Liver tissues from C57BL/6J mice were processed for hematoxylin and eosin staining. Scale bar: 100 μm; C: Liver tissues from C57BL/6J mice were processed glutamine synthetase immunofluorescence staining (green). Scale bar: 100 μm. Representative images are displayed, with six mice in each group. The experiment was repeated at least three times to ensure reproducibility and reliability of the results. PV: Portal vessels; CV: Central vessels; GS: Glutamine synthetase; HE: Hematoxylin and eosin; IR: Ischemia-reperfusion.
- Citation: Huang ZH, Dong MQ, Liu FY, Zhou WJ. Dynamics of glutamine synthetase expression in hepatic ischemia-reperfusion injury: Implications for therapeutic interventions. World J Hepatol 2024; 16(8): 1177-1184
- URL: https://www.wjgnet.com/1948-5182/full/v16/i8/1177.htm
- DOI: https://dx.doi.org/10.4254/wjh.v16.i8.1177


