Copyright
©The Author(s) 2024.
World J Hepatol. Aug 27, 2024; 16(8): 1167-1176
Published online Aug 27, 2024. doi: 10.4254/wjh.v16.i8.1167
Published online Aug 27, 2024. doi: 10.4254/wjh.v16.i8.1167
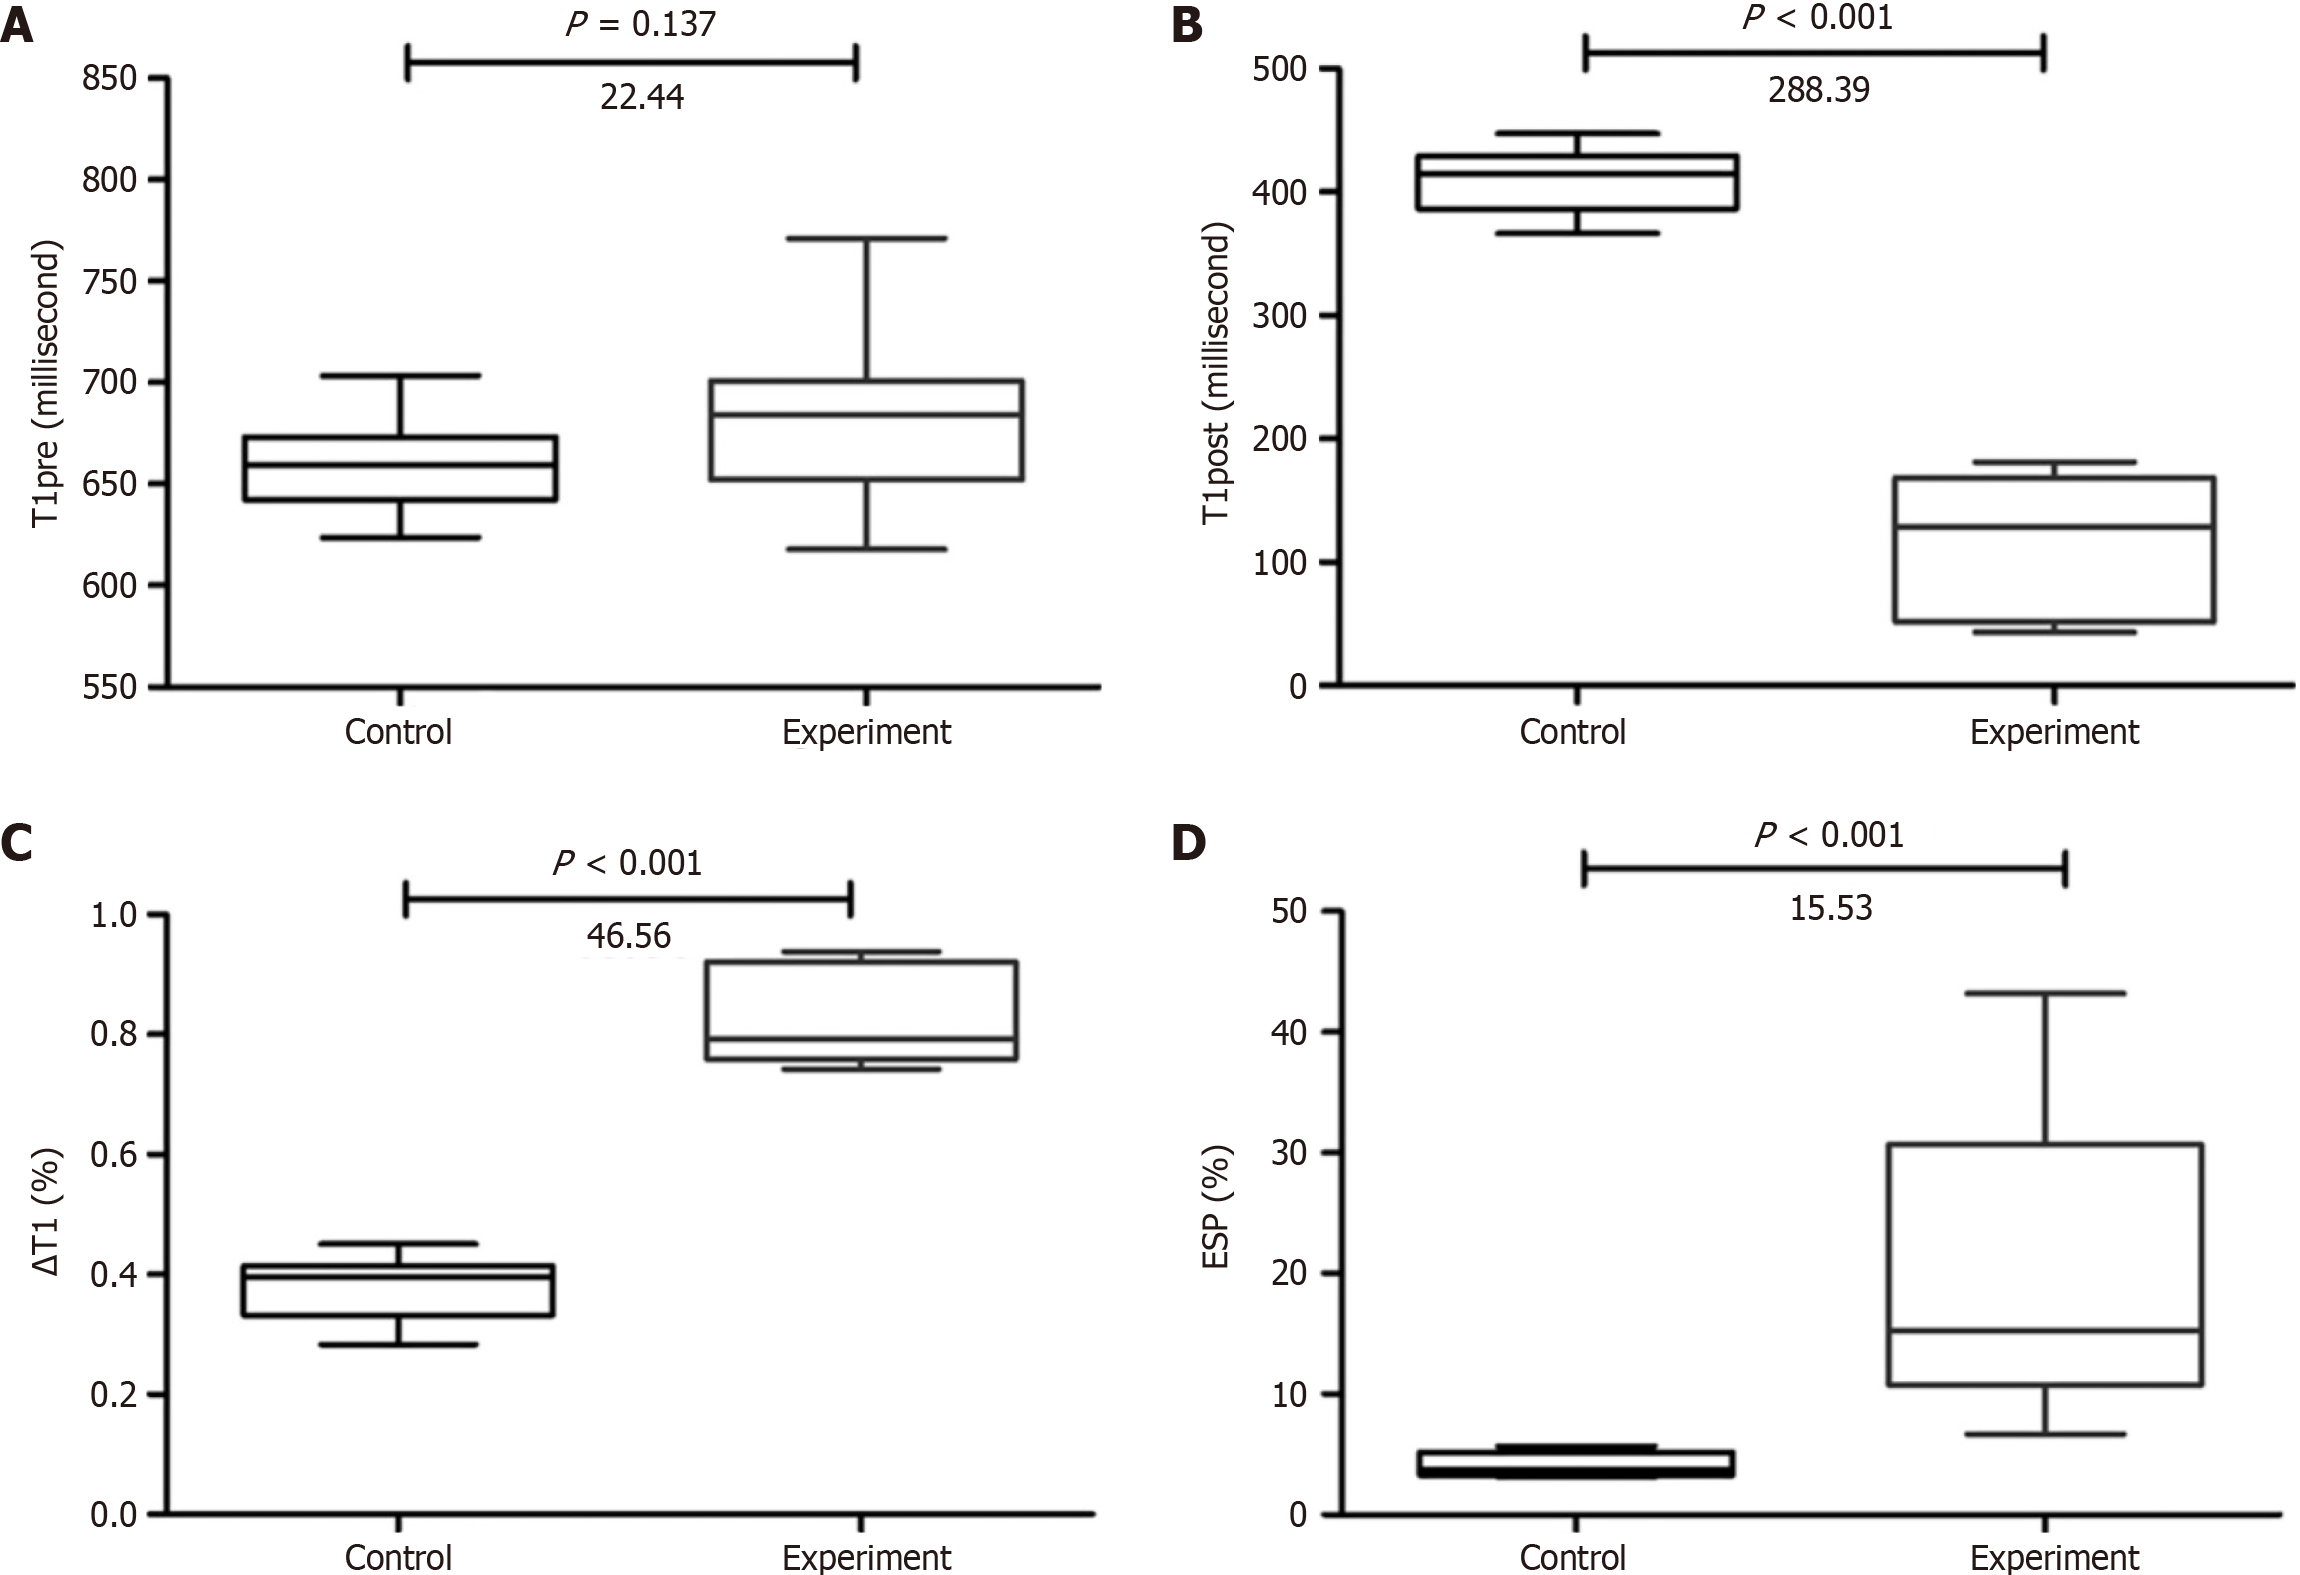
Figure 4 Box plots in control and experimental groups.
A: Box plots of T1 relaxation time before enhancement (T1pre); B: T1 relaxation times 20 minutes after enhancement (T1post); C: The reduction of T1 relaxation time (△T1%); D: The first enhancement slope percentage of the liver parenchyma in control and experimental groups. T1pre: T1 relaxation time before enhancement; T1post: T1 relaxation time 20 minutes after enhancement; △T1%: Reduction rate of T1 relaxation time; ESP: The first enhancement slope percentage in liver parenchyma.
- Citation: Chen YY, Yang L, Li J, Rao SX, Ding Y, Zeng MS. Gadoxetic acid-enhanced magnetic resonance imaging in the assessment of hepatic sinusoidal obstruction syndrome in a mouse model. World J Hepatol 2024; 16(8): 1167-1176
- URL: https://www.wjgnet.com/1948-5182/full/v16/i8/1167.htm
- DOI: https://dx.doi.org/10.4254/wjh.v16.i8.1167


