Copyright
©The Author(s) 2024.
World J Hepatol. Aug 27, 2024; 16(8): 1167-1176
Published online Aug 27, 2024. doi: 10.4254/wjh.v16.i8.1167
Published online Aug 27, 2024. doi: 10.4254/wjh.v16.i8.1167
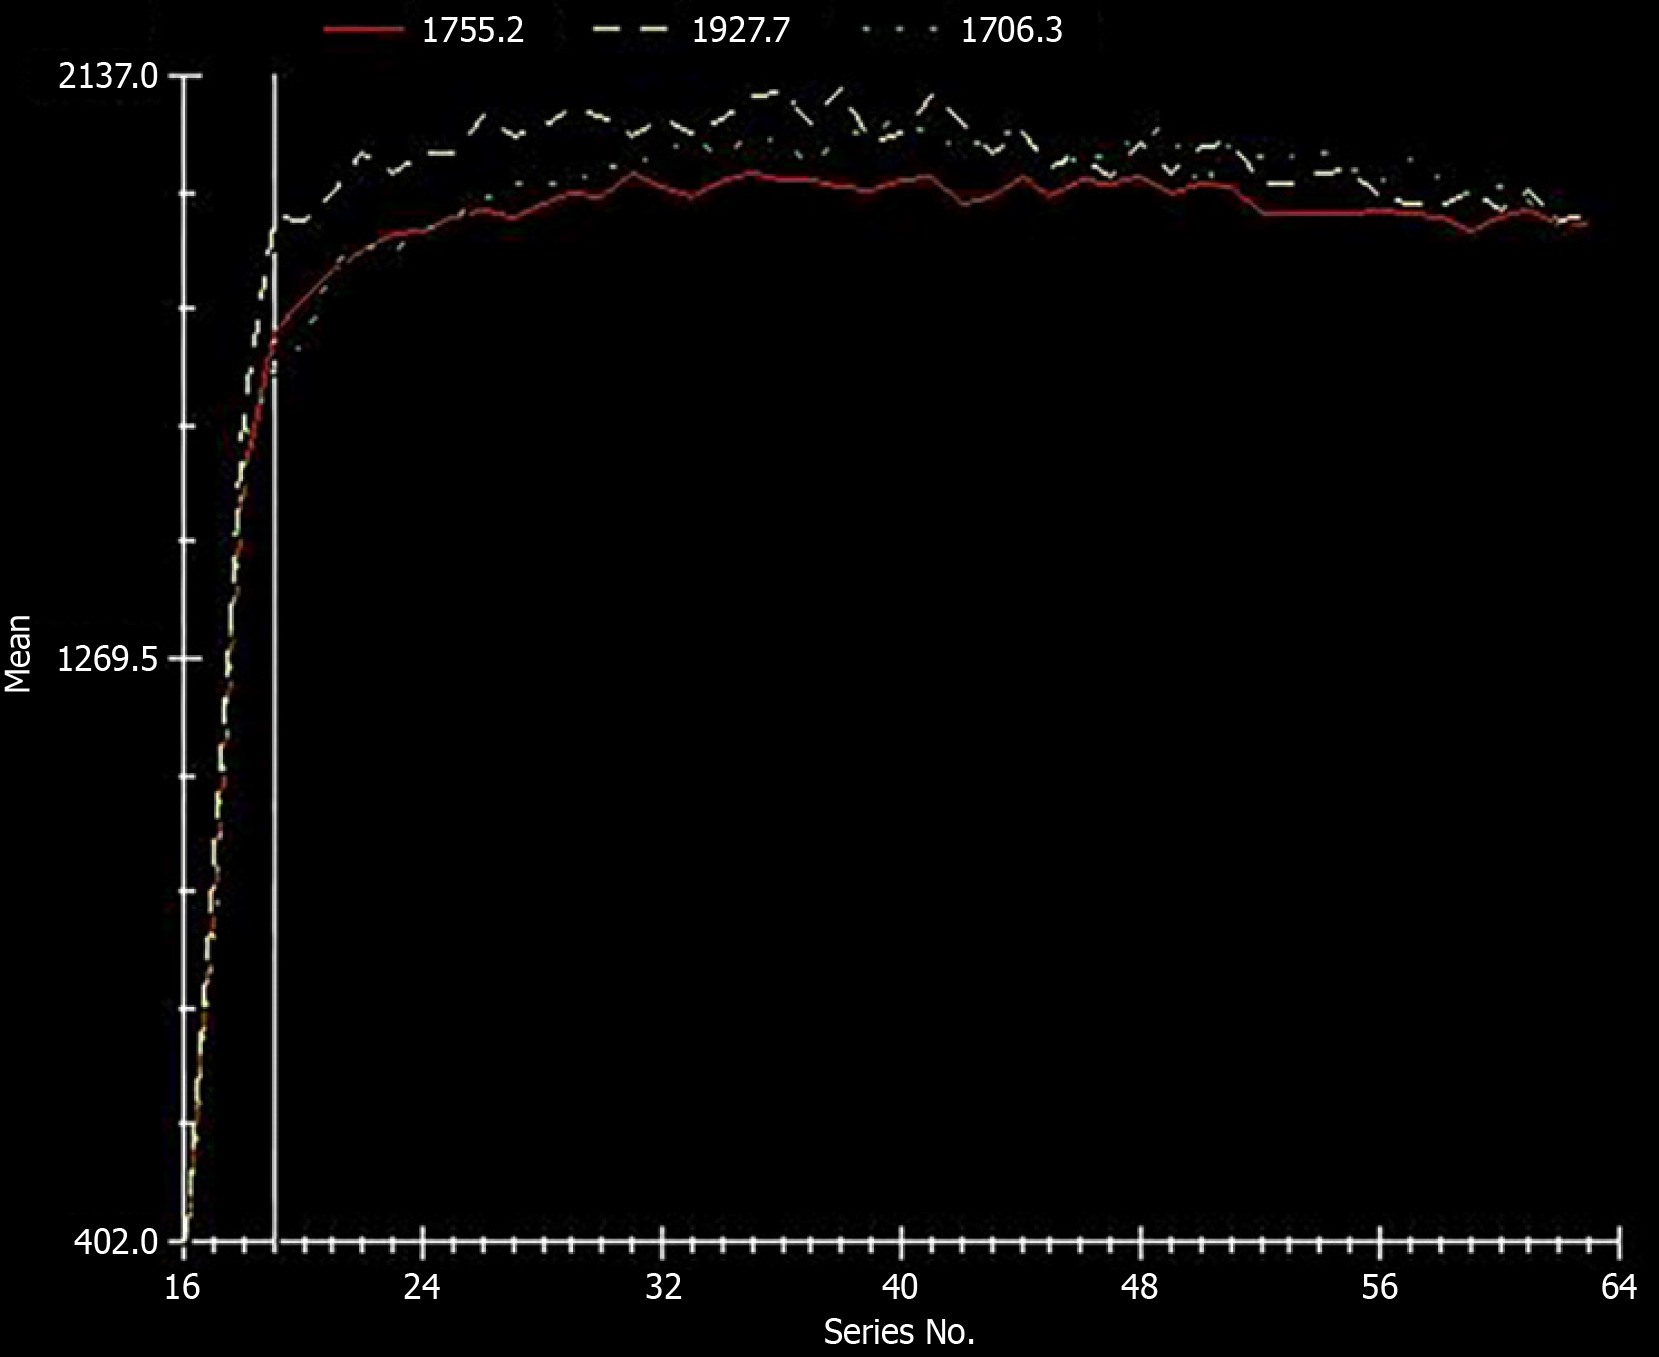
Figure 2 Liver parenchyma time–signal curve: The x axis represents the time axis, and the y axis represents T1 relaxation time, and the slope represents the first rapid enhancement slope percentage.
The three lines represent the values of the three regions of interest (ROIs). We selected the same ROIs in the liver parenchyma for T1 mapping.
- Citation: Chen YY, Yang L, Li J, Rao SX, Ding Y, Zeng MS. Gadoxetic acid-enhanced magnetic resonance imaging in the assessment of hepatic sinusoidal obstruction syndrome in a mouse model. World J Hepatol 2024; 16(8): 1167-1176
- URL: https://www.wjgnet.com/1948-5182/full/v16/i8/1167.htm
- DOI: https://dx.doi.org/10.4254/wjh.v16.i8.1167


