Copyright
©The Author(s) 2024.
World J Hepatol. Aug 27, 2024; 16(8): 1111-1119
Published online Aug 27, 2024. doi: 10.4254/wjh.v16.i8.1111
Published online Aug 27, 2024. doi: 10.4254/wjh.v16.i8.1111
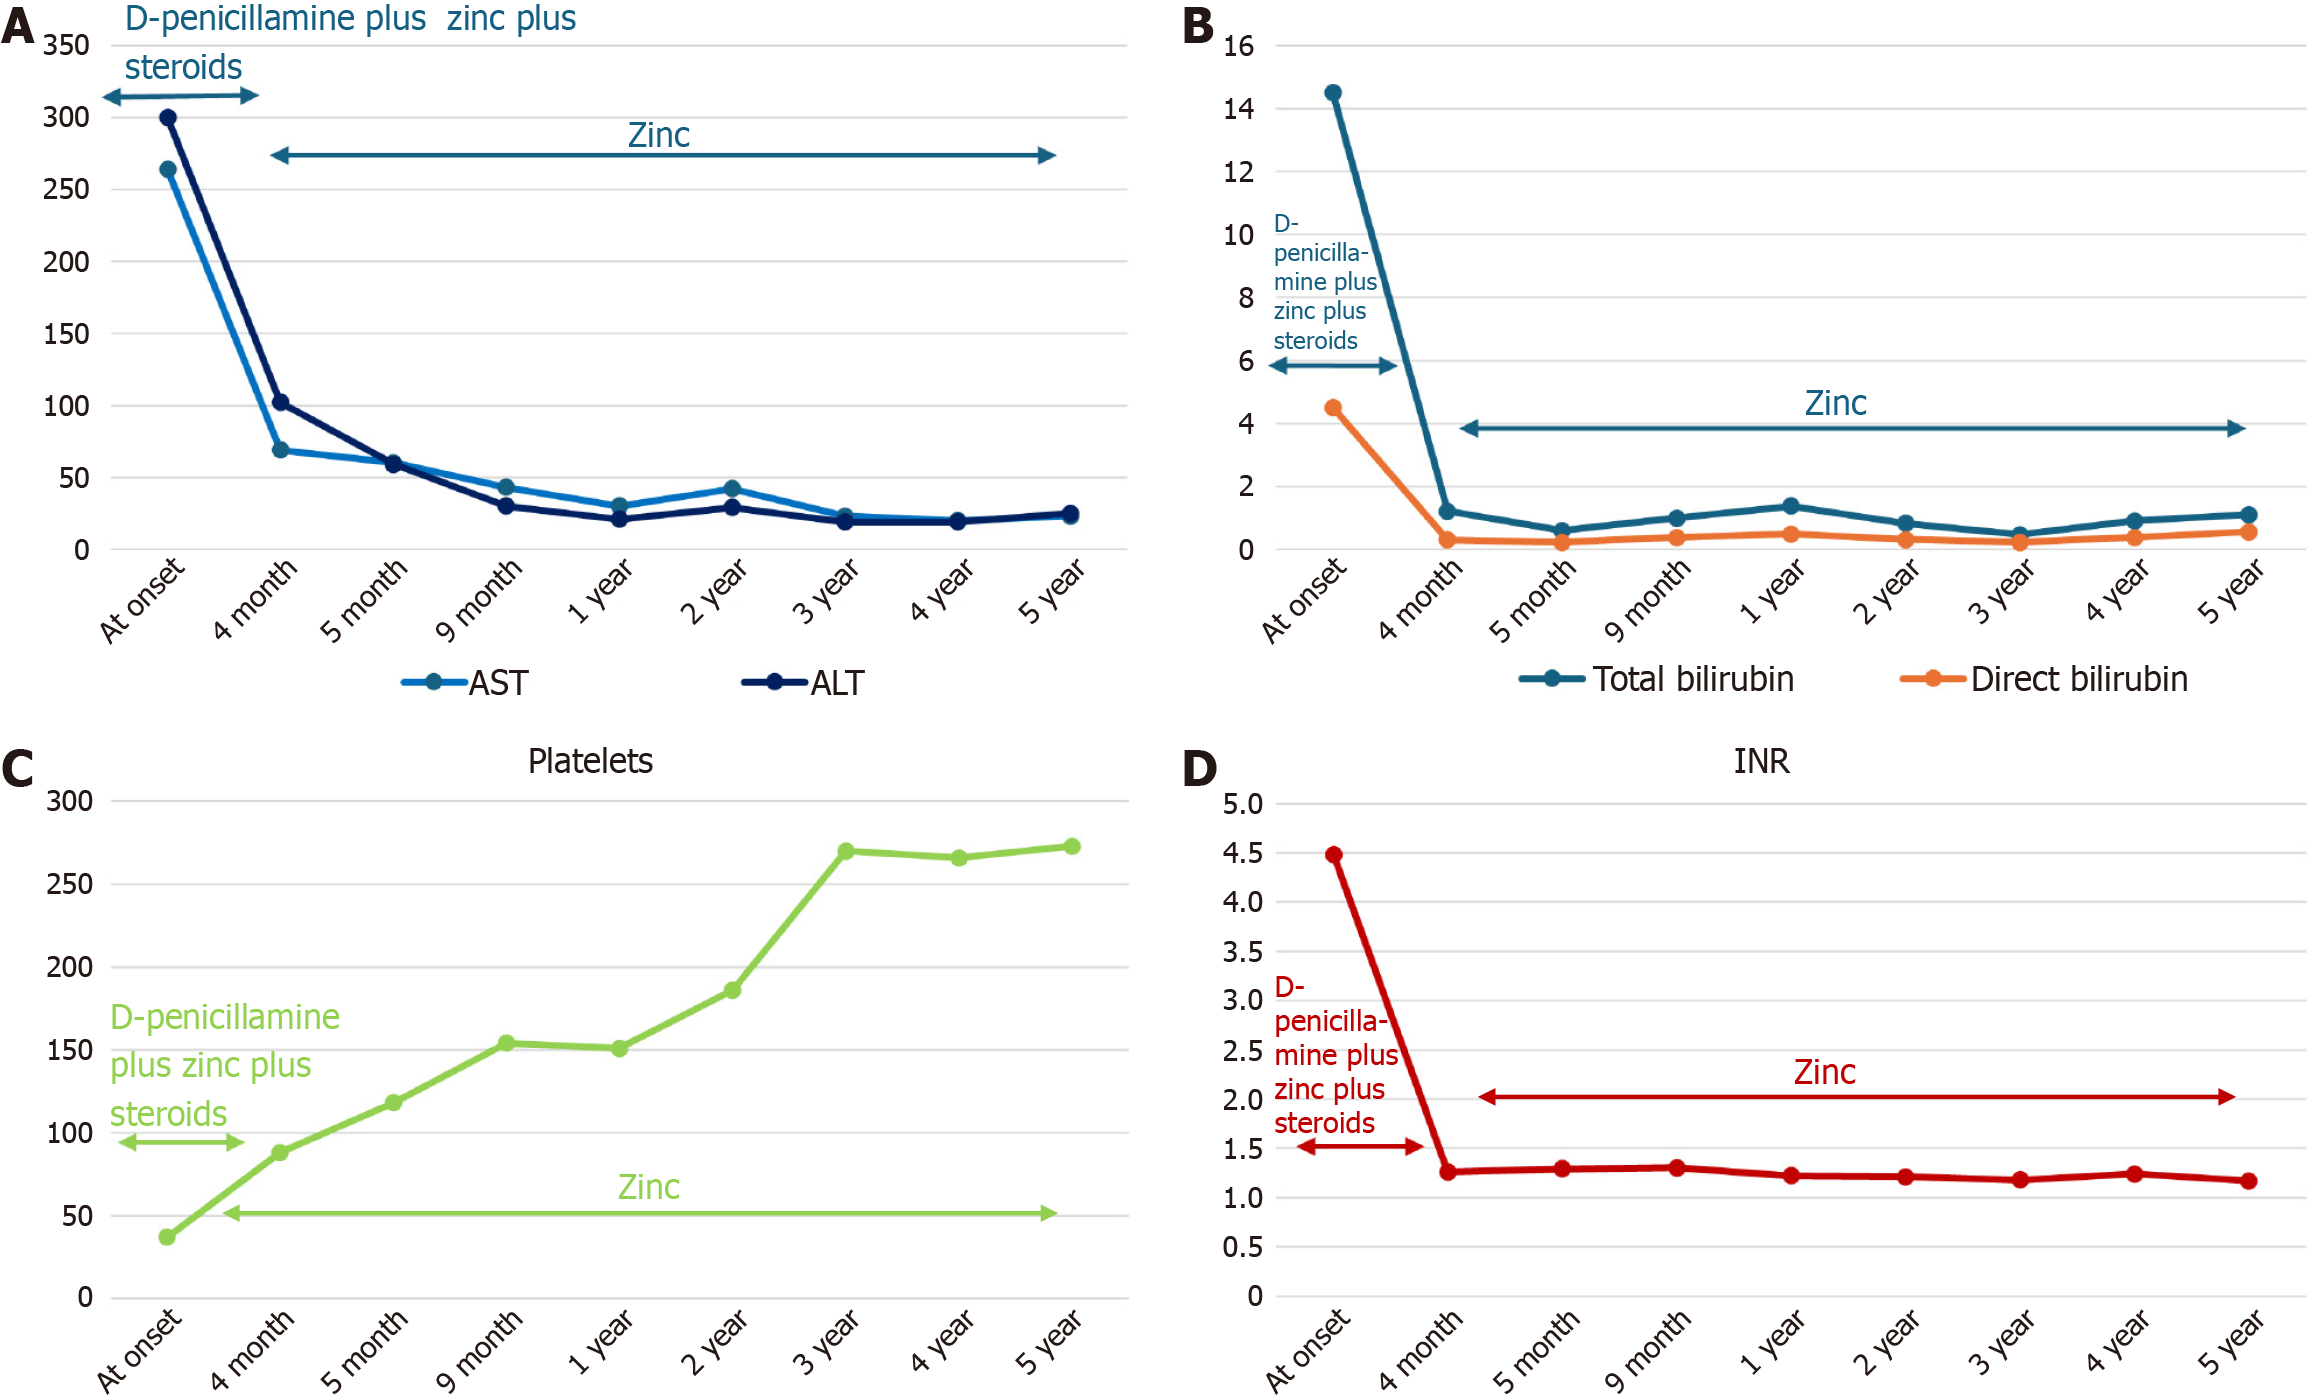
Figure 2 Time course of laboratory data and response to treatment in a patient with acute liver failure due to Wilson’s disease (Case 1).
This figure shows the temporal trend of laboratory data and treatment from the onset to the last observation. A: Temporal trend of liver enzymes (expressed as UI/L); B: Temporal trend of bilirubin levels (expressed as mg/dL); C: Temporal trend of platelets (expressed as × 103 /μL); D: Temporal trend of international normalized ratio. AST: Aspartate aminotransferase; ALT: Alanine aminotransferase; INR: International normalized ratio.
- Citation: Delle Cave V, Di Dato F, Calvo PL, Spagnuolo MI, Iorio R. Successful treatment of acute liver failure due to Wilson’s disease: Serendipity or fortuity? World J Hepatol 2024; 16(8): 1111-1119
- URL: https://www.wjgnet.com/1948-5182/full/v16/i8/1111.htm
- DOI: https://dx.doi.org/10.4254/wjh.v16.i8.1111


