Copyright
©The Author(s) 2024.
World J Hepatol. Apr 27, 2024; 16(4): 625-639
Published online Apr 27, 2024. doi: 10.4254/wjh.v16.i4.625
Published online Apr 27, 2024. doi: 10.4254/wjh.v16.i4.625
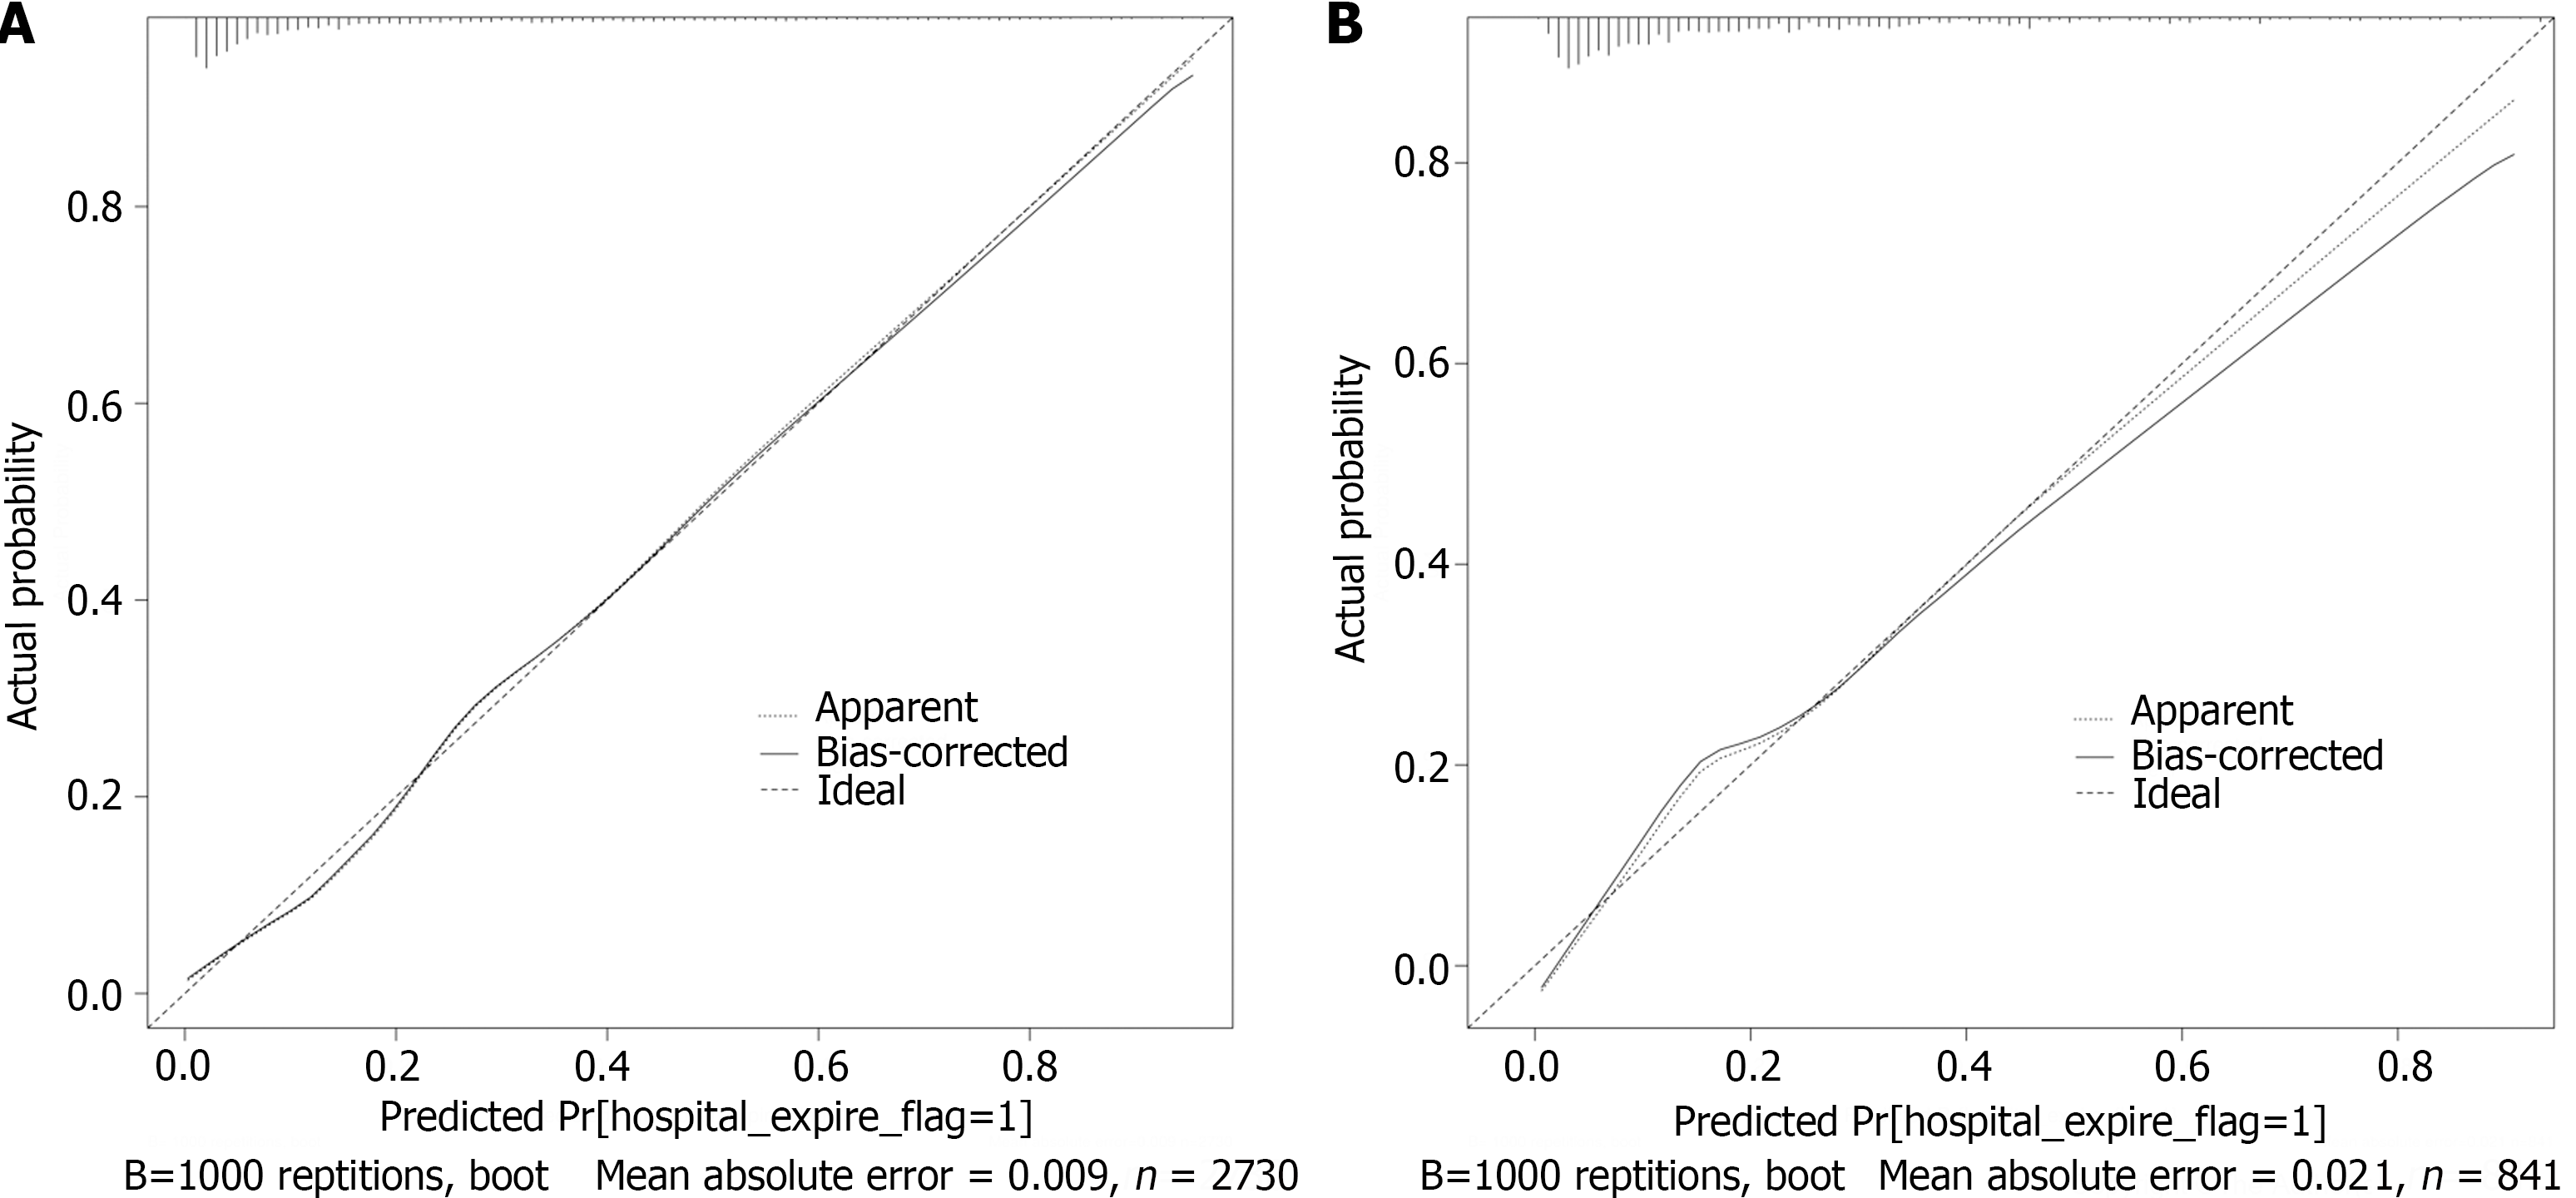
Figure 5 Calibration curves.
A: The training dataset; B: The test dataset. The X-axis and Y-axis represent the predicted and actual probability of hospital mortality, respectively. The apparent and bias-corrected lines show that the predicted probability and adjusted predicted probability fit the actual probability.
- Citation: Tang XW, Ren WS, Huang S, Zou K, Xu H, Shi XM, Zhang W, Shi L, Lü MH. Development and validation of a nomogram for predicting in-hospital mortality of intensive care unit patients with liver cirrhosis. World J Hepatol 2024; 16(4): 625-639
- URL: https://www.wjgnet.com/1948-5182/full/v16/i4/625.htm
- DOI: https://dx.doi.org/10.4254/wjh.v16.i4.625


