Copyright
©The Author(s) 2024.
World J Hepatol. Apr 27, 2024; 16(4): 601-611
Published online Apr 27, 2024. doi: 10.4254/wjh.v16.i4.601
Published online Apr 27, 2024. doi: 10.4254/wjh.v16.i4.601
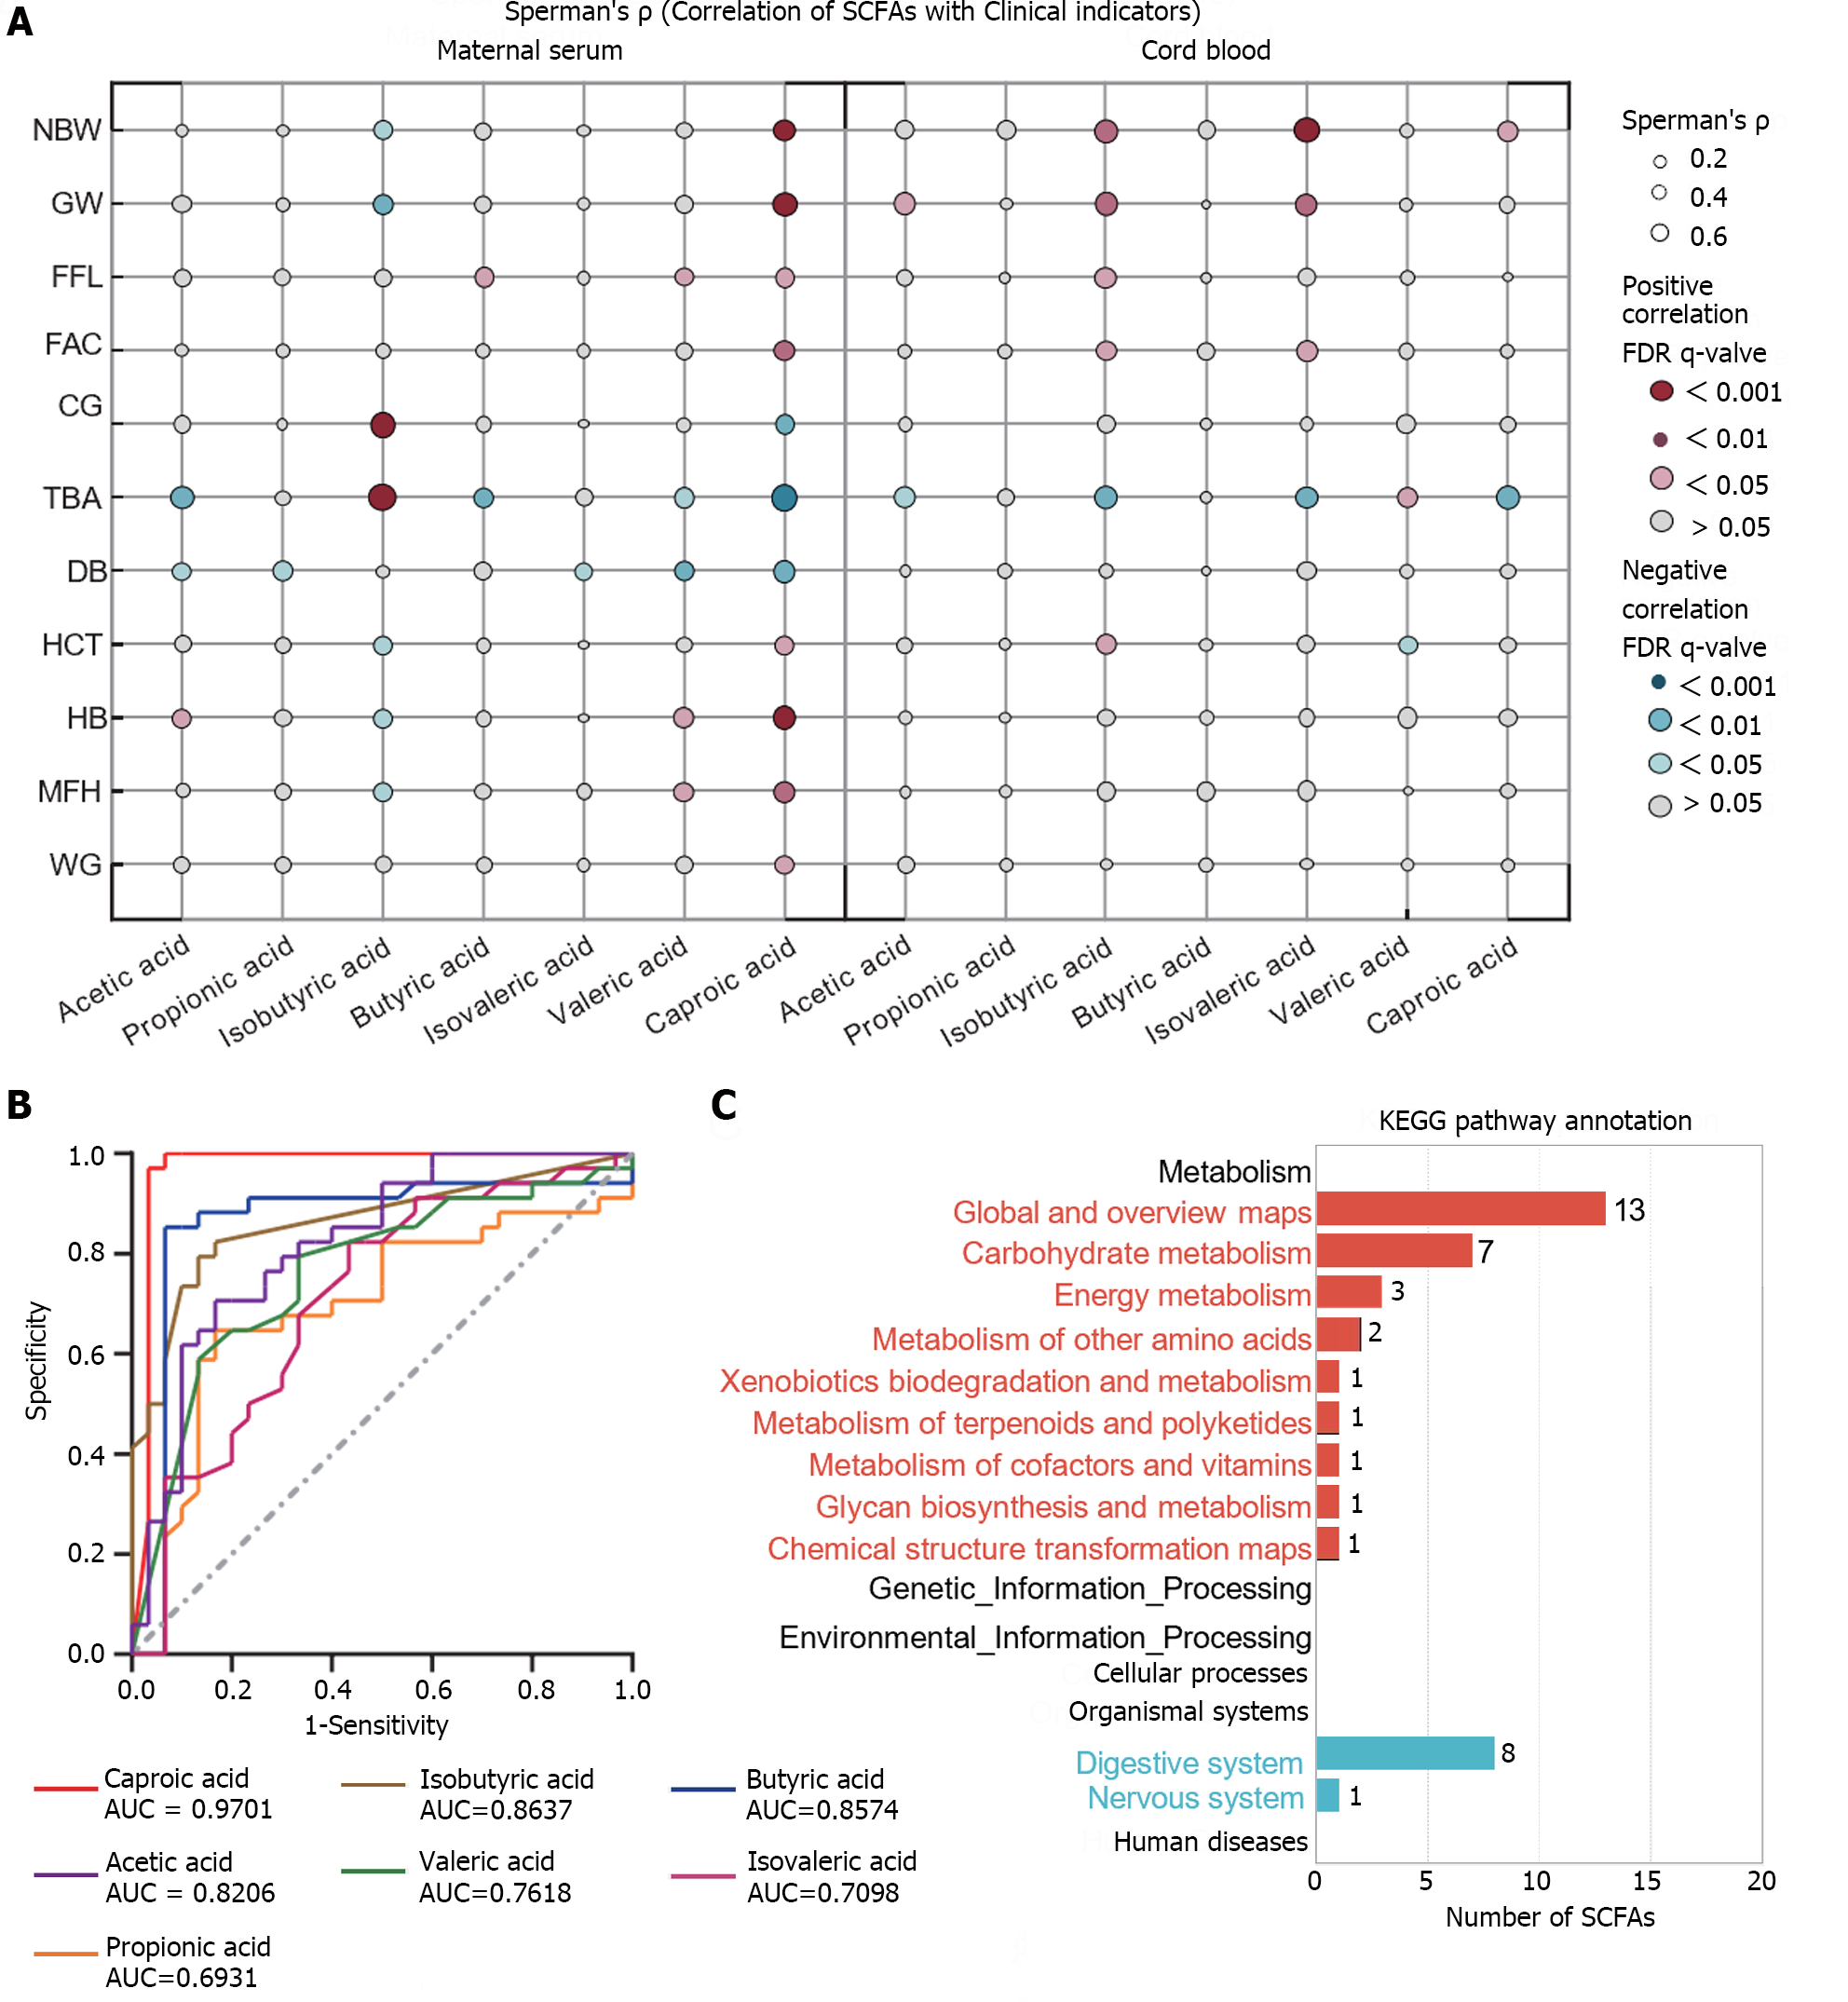
Figure 4 Clinical significance and functional analysis of differential short-chain fatty acids.
A: Bubble chart depicting the correlation between short-chain fatty acids (SCFAs) and clinical indicators: Whether in maternal serum or cord blood, the correlation between acetic acid and caproic acid as well as clinical indicators showed the same trend. The size of the bubble represents the correlation levels. The color of the bubble represents the FDR levels. Red: Positive correlation; Blue: Negative correlation; B: The receiver operating characteristic (ROC) curve of maternal serum SCFAs for individual diagnosis of intrahepatic cholestasis of pregnancy: the diagnostic accuracy of caproic acid was 97.01%; C: Summary of the secondary classification of Kyoto Encyclopedia of Genes and Genomes pathway enrichment results: mainly involving metabolic pathways and biological system pathways, including carbohydrate metabolism, capacity metabolism, digestive system, and nervous system. For maternal blood, NP: n = 30; ICP: n = 34. For cord blood, NP: n = 22; ICP n = 20. NBW: Neonatal birth weight; GW: Gestational week of delivery; FFL: Fetal femur length; FAC: Fetal abdominal circumference; CG: Cholyglycine; TBA: Total bile acid; DB: Direct bilirubin; HCT: Hematocrit; HB: Hemoglobin; MFH: Maternal fundal height; WG: Weight gain during pregnancy.
- Citation: Ren SJ, Feng JT, Xiang T, Liao CL, Zhou YP, Xuan RR. Expression and clinical significance of short-chain fatty acids in patients with intrahepatic cholestasis of pregnancy. World J Hepatol 2024; 16(4): 601-611
- URL: https://www.wjgnet.com/1948-5182/full/v16/i4/601.htm
- DOI: https://dx.doi.org/10.4254/wjh.v16.i4.601


