Copyright
©The Author(s) 2024.
World J Hepatol. Mar 27, 2024; 16(3): 405-417
Published online Mar 27, 2024. doi: 10.4254/wjh.v16.i3.405
Published online Mar 27, 2024. doi: 10.4254/wjh.v16.i3.405
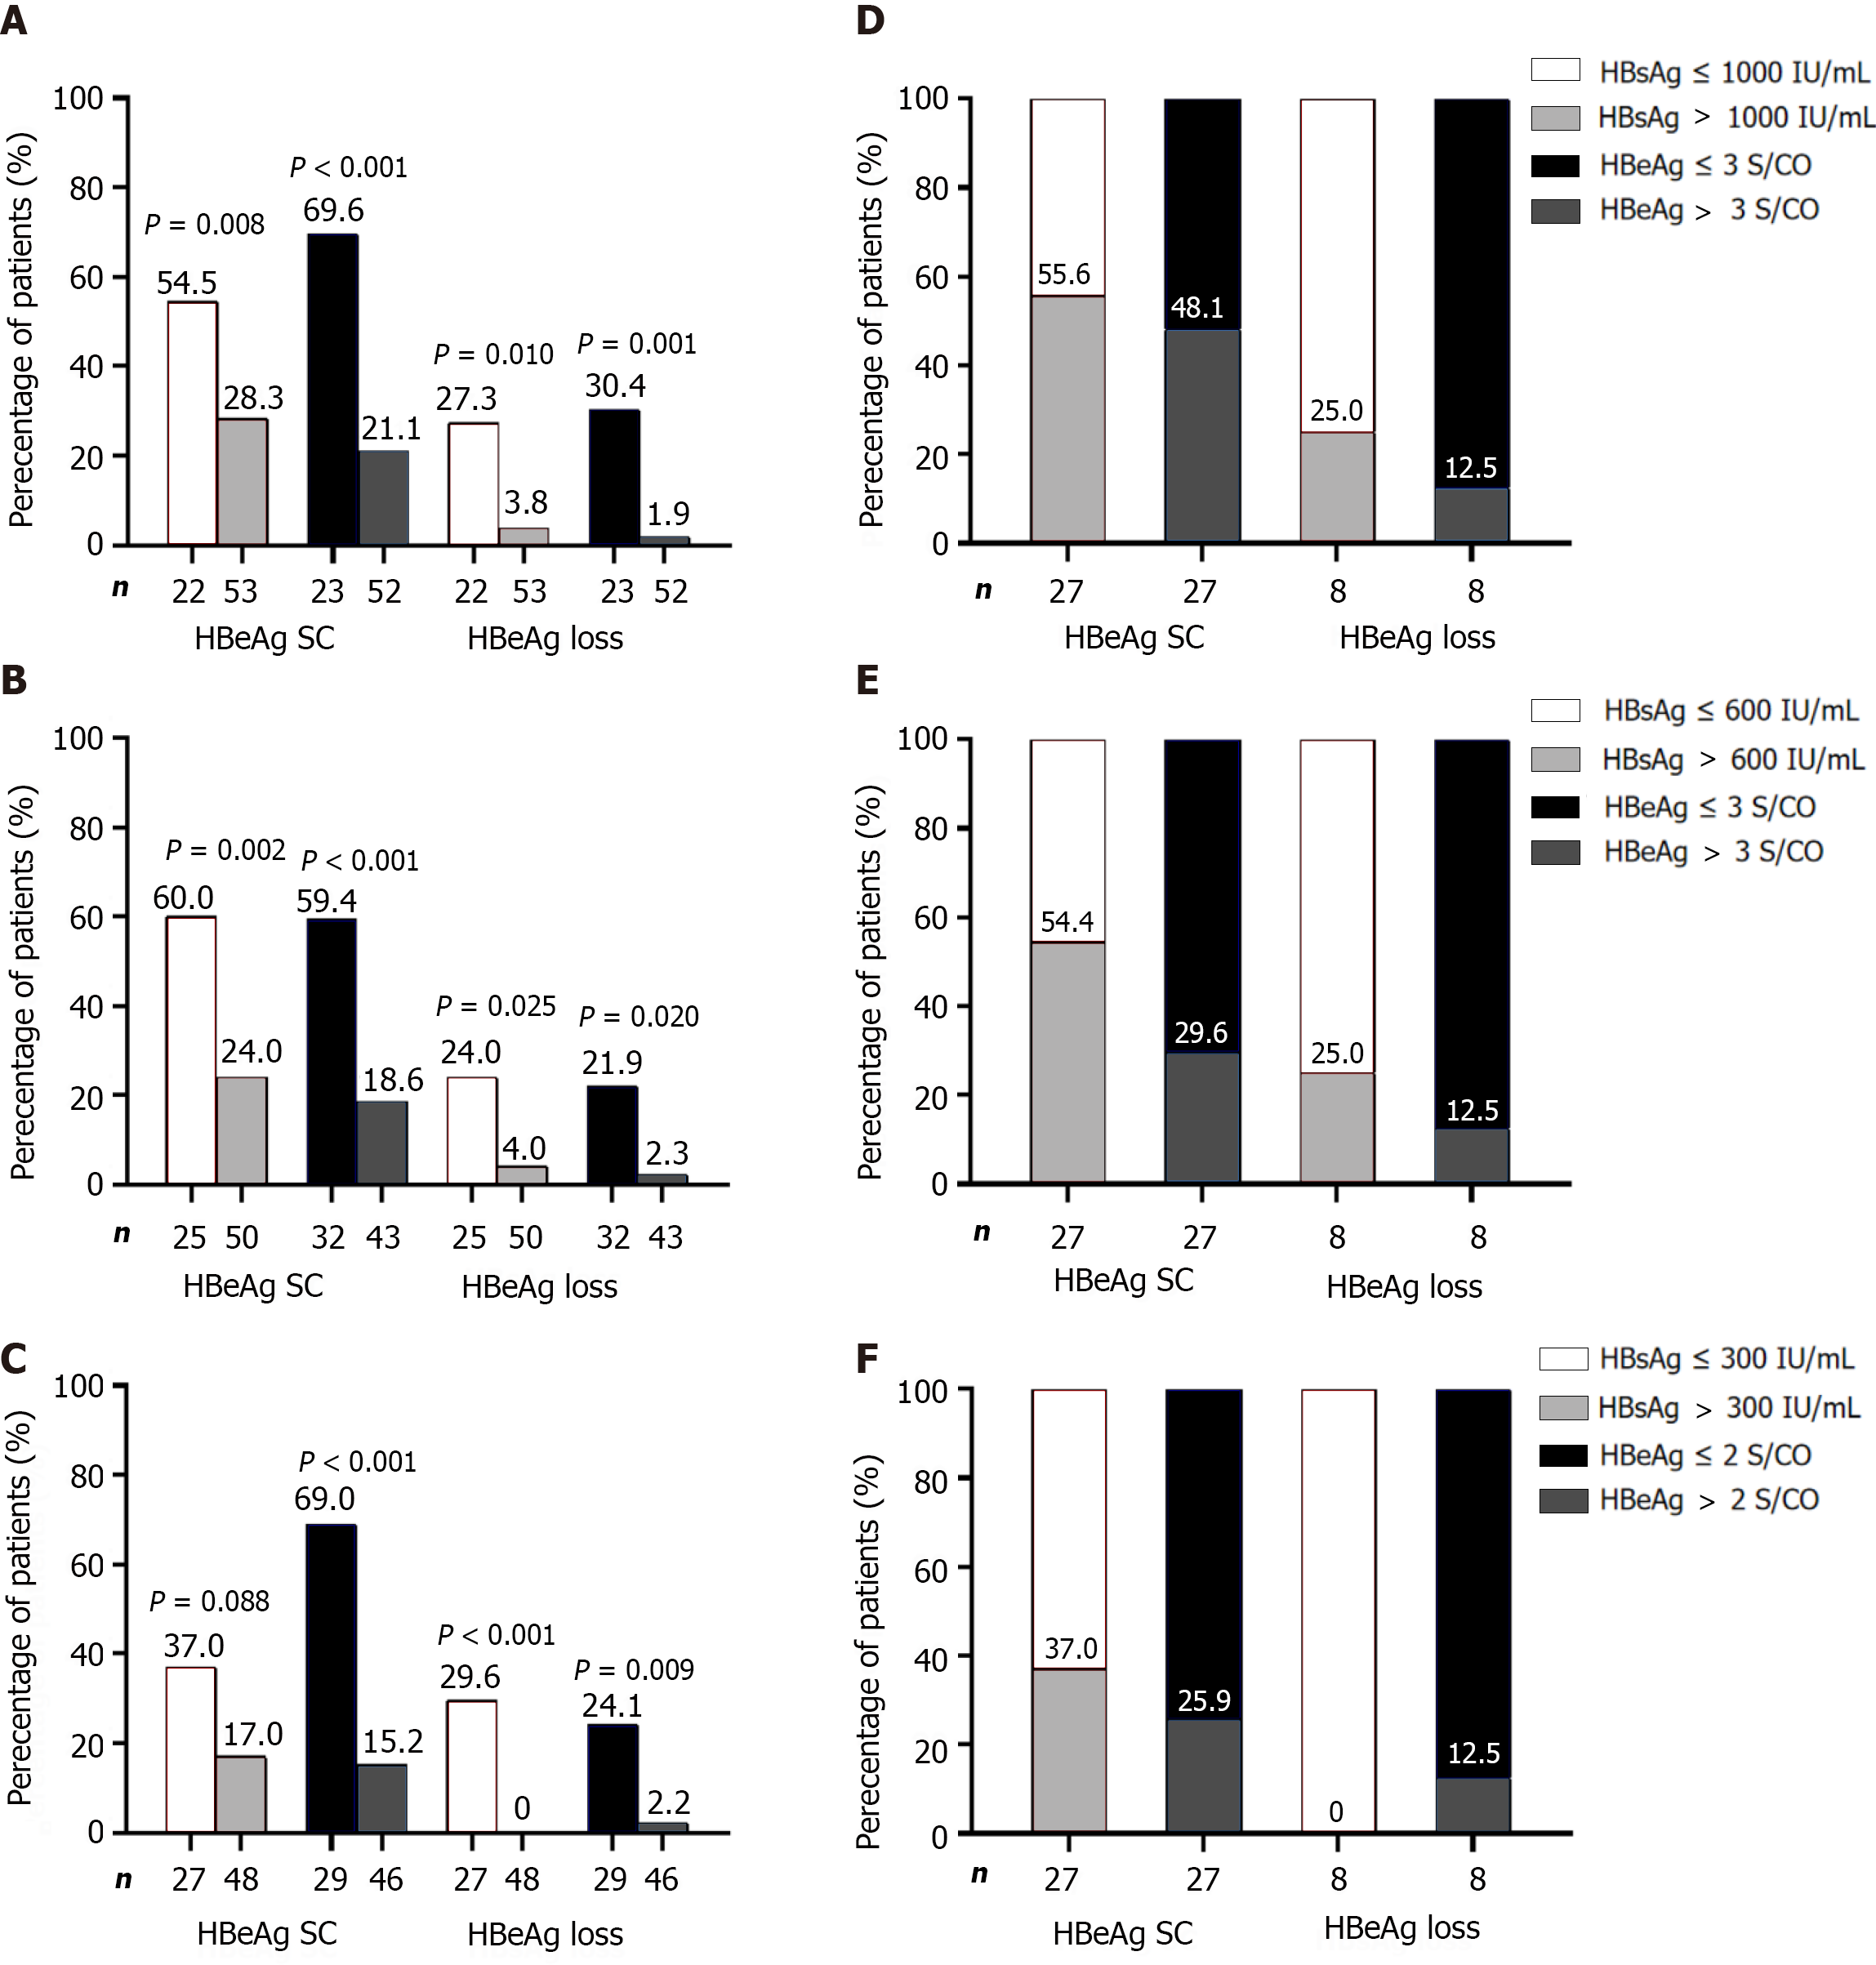
Figure 2 Response and hepatitis B surface antigen loss rates at 24 wk post-treatment based on patients who met single hepatitis B surface antigen or hepatitis B e antigen cutoffs at each time point.
A-F: Moreover, the proportion of patients who met the single hepatitis B surface antigen (HBsAg) or hepatitis B e antigen (HBeAg) cutoffs at each time point was determined based on patients that achieved response and HBsAg loss at 24 wk post-treatment. Baseline (A and D), week 12 (B and E), week 24 (C and F). HBsAg: Hepatitis B surface antigen; HBeAg: Hepatitis B e antigen.
- Citation: Zhang PX, Zheng XW, Zhang YF, Ye J, Li W, Tang QQ, Zhu J, Zou GZ, Zhang ZH. Prediction model for hepatitis B e antigen seroconversion in chronic hepatitis B with peginterferon-alfa treated based on a response-guided therapy strategy. World J Hepatol 2024; 16(3): 405-417
- URL: https://www.wjgnet.com/1948-5182/full/v16/i3/405.htm
- DOI: https://dx.doi.org/10.4254/wjh.v16.i3.405


