Copyright
©The Author(s) 2024.
World J Hepatol. Dec 27, 2024; 16(12): 1480-1492
Published online Dec 27, 2024. doi: 10.4254/wjh.v16.i12.1480
Published online Dec 27, 2024. doi: 10.4254/wjh.v16.i12.1480
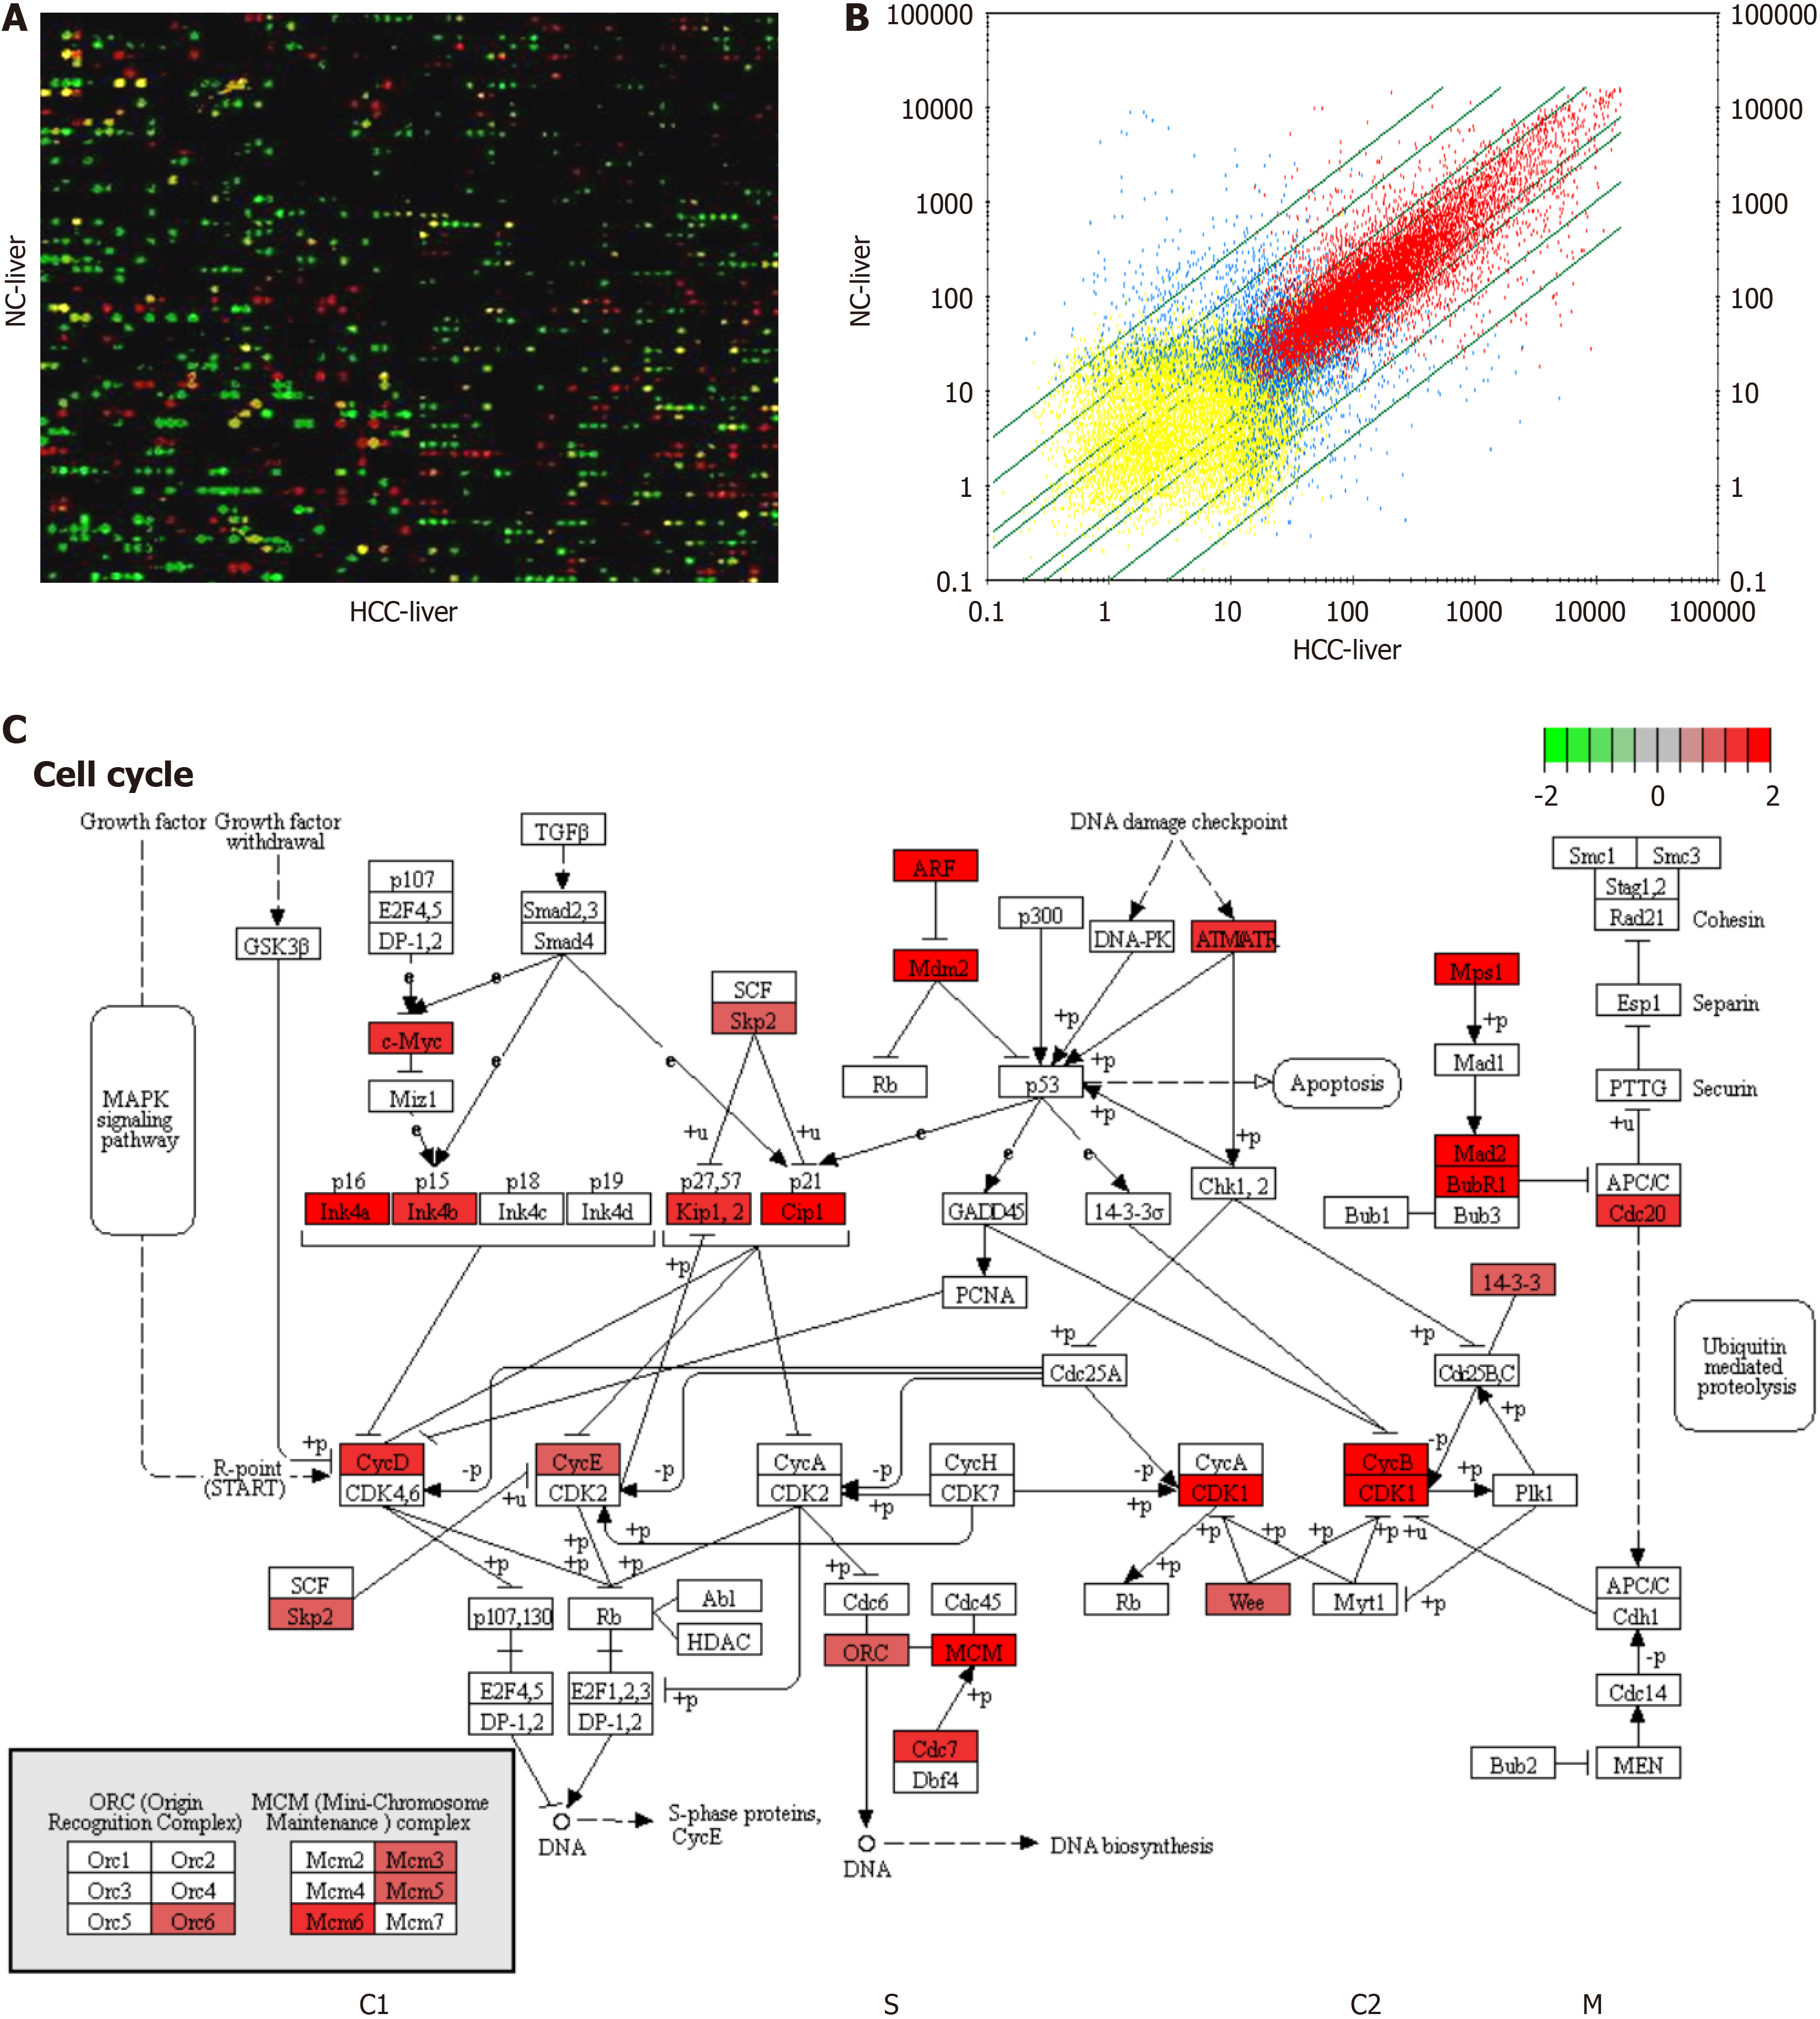
Figure 2 Alterations in whole gene expression profiling.
A: Microarray analysis of the expression levels of a total of 28000 genes between rat hepatocellular carcinoma and normal control liver samples by false color imaging; B: The scatter plot of gene alterations between rat hepatocellular carcinoma and normal control livers is shown in a volcano plot; C: Gene upregulation in the cell cycle in hepato- carcinogenesis model rats. NC: Normal control; HCC: Hepatocellular carcinoma.
- Citation: Yang JL, Yang J, Fang RF, Sai WL, Yao DF, Yao M. Hypoxia upregulates hepatic angiopoietin-2 transcription to promote the progression of hepatocellular carcinoma. World J Hepatol 2024; 16(12): 1480-1492
- URL: https://www.wjgnet.com/1948-5182/full/v16/i12/1480.htm
- DOI: https://dx.doi.org/10.4254/wjh.v16.i12.1480


