Copyright
©The Author(s) 2024.
World J Hepatol. Nov 27, 2024; 16(11): 1255-1264
Published online Nov 27, 2024. doi: 10.4254/wjh.v16.i11.1255
Published online Nov 27, 2024. doi: 10.4254/wjh.v16.i11.1255
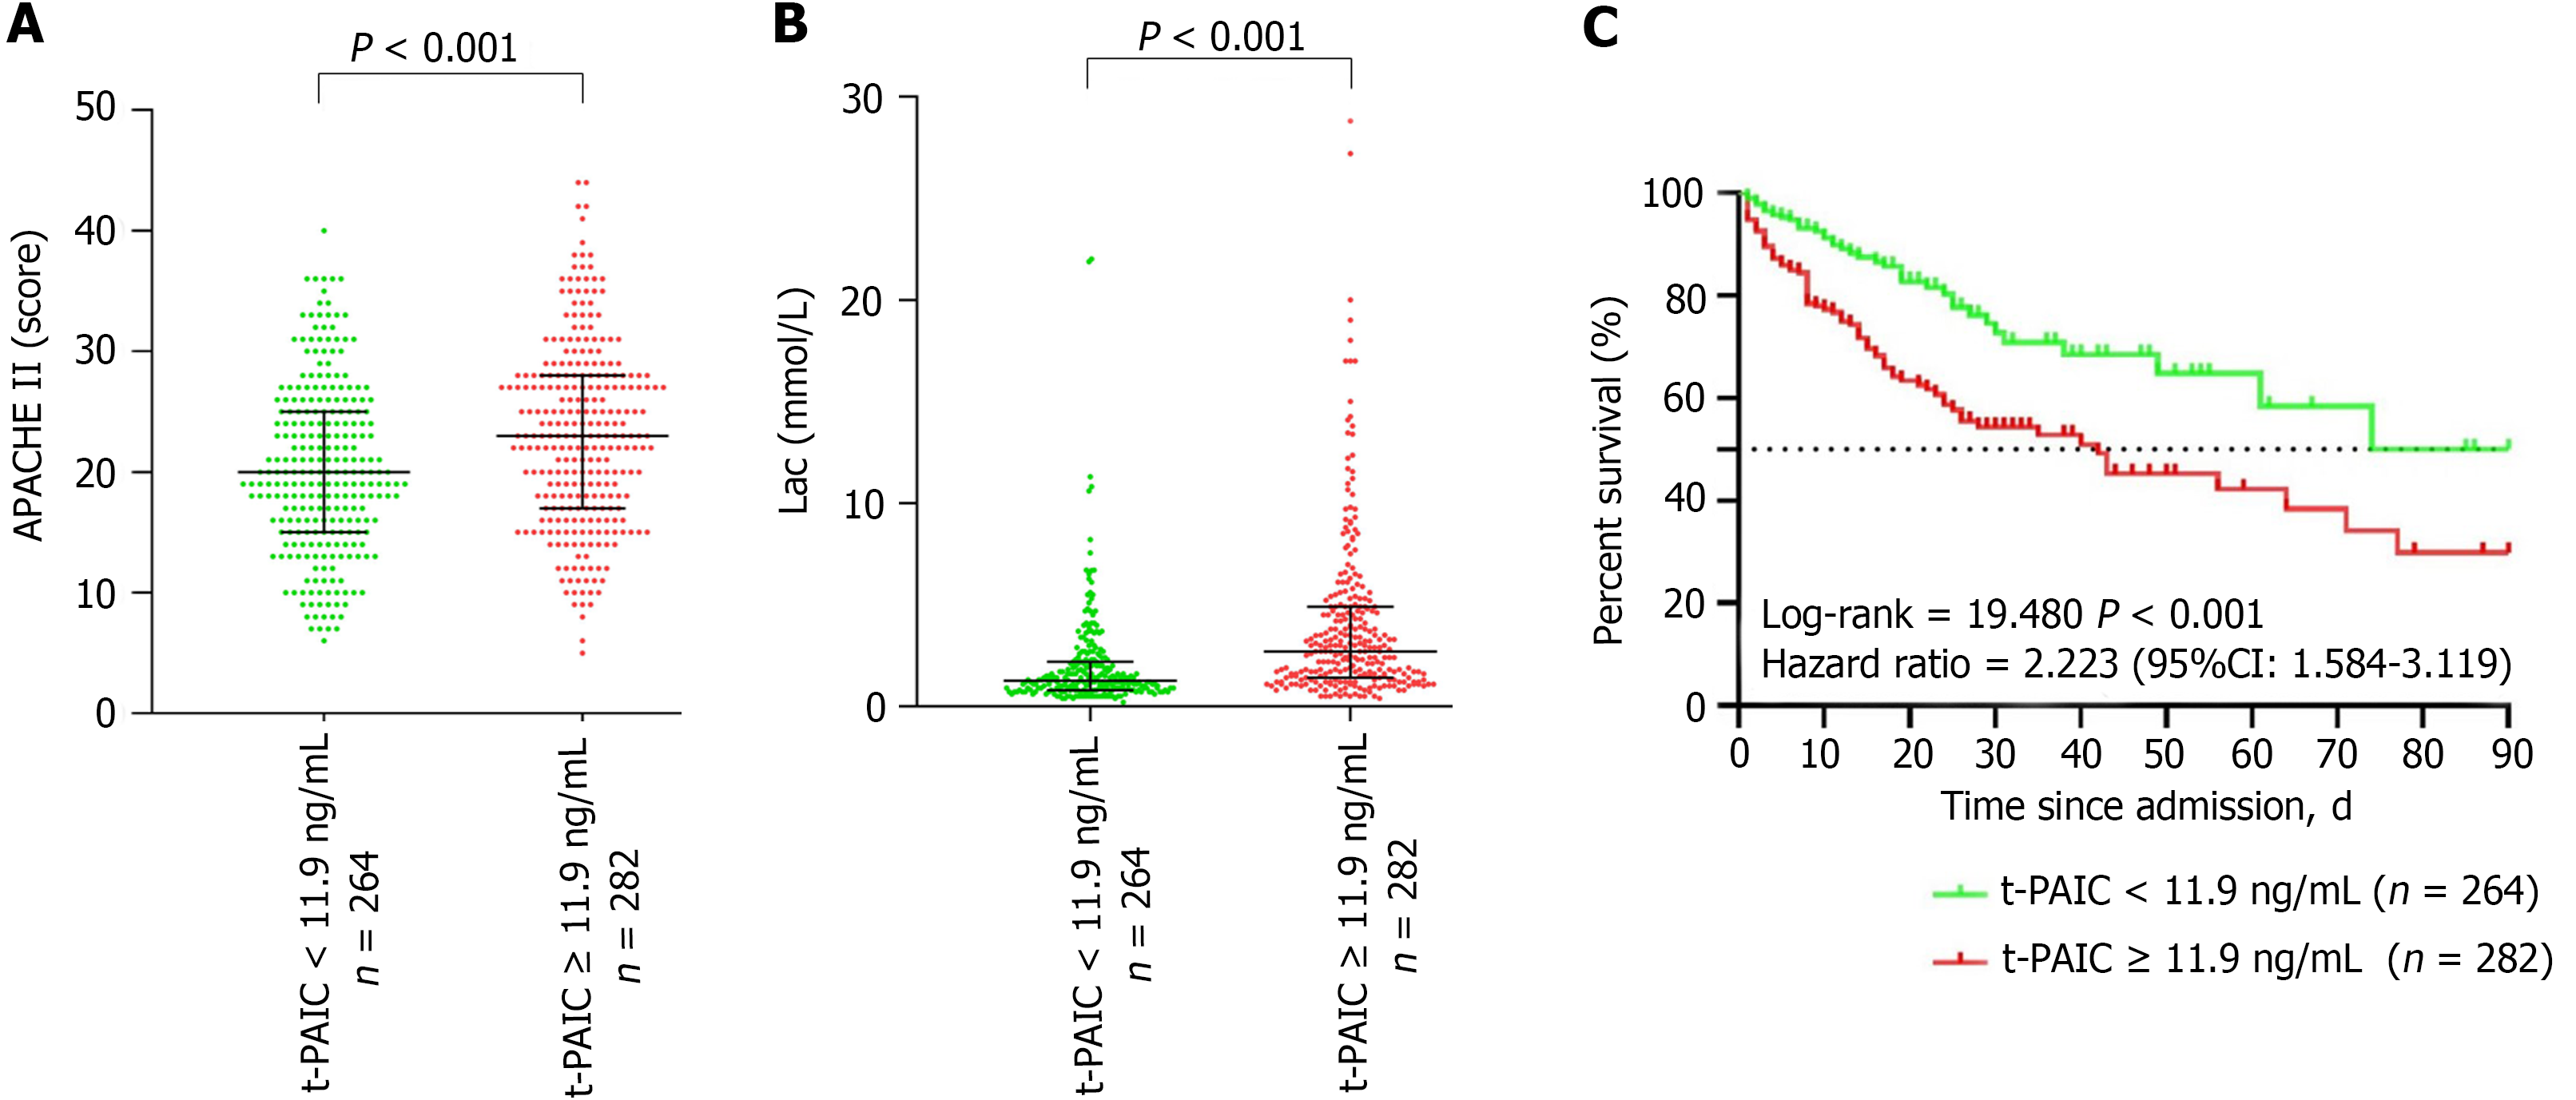
Figure 4 Comparison of patients stratified based on an optimal tissue plasminogen activator-inhibitor complex cutoff of 11.
9 ng/mL. A: Acute Physiology and Chronic Health Evaluation II score; B: Lactate levels; C: Kaplan-Meier survival curves. APACHE II: Acute Physiology and Chronic Health Evaluation II; t-PAIC: Tissue plasminogen activator-inhibitor complex; Lac: Lactate; CI: Confidence interval.
- Citation: Zhou Y, He LP, Qi YH, Huang Y, Hu BQ, Liu JL, Zeng QB, Song JC. Diagnostic value of tissue plasminogen activator-inhibitor complex in sepsis-induced liver injury: A single-center retrospective case-control study. World J Hepatol 2024; 16(11): 1255-1264
- URL: https://www.wjgnet.com/1948-5182/full/v16/i11/1255.htm
- DOI: https://dx.doi.org/10.4254/wjh.v16.i11.1255


