Copyright
©The Author(s) 2024.
World J Hepatol. Oct 27, 2024; 16(10): 1188-1198
Published online Oct 27, 2024. doi: 10.4254/wjh.v16.i10.1188
Published online Oct 27, 2024. doi: 10.4254/wjh.v16.i10.1188
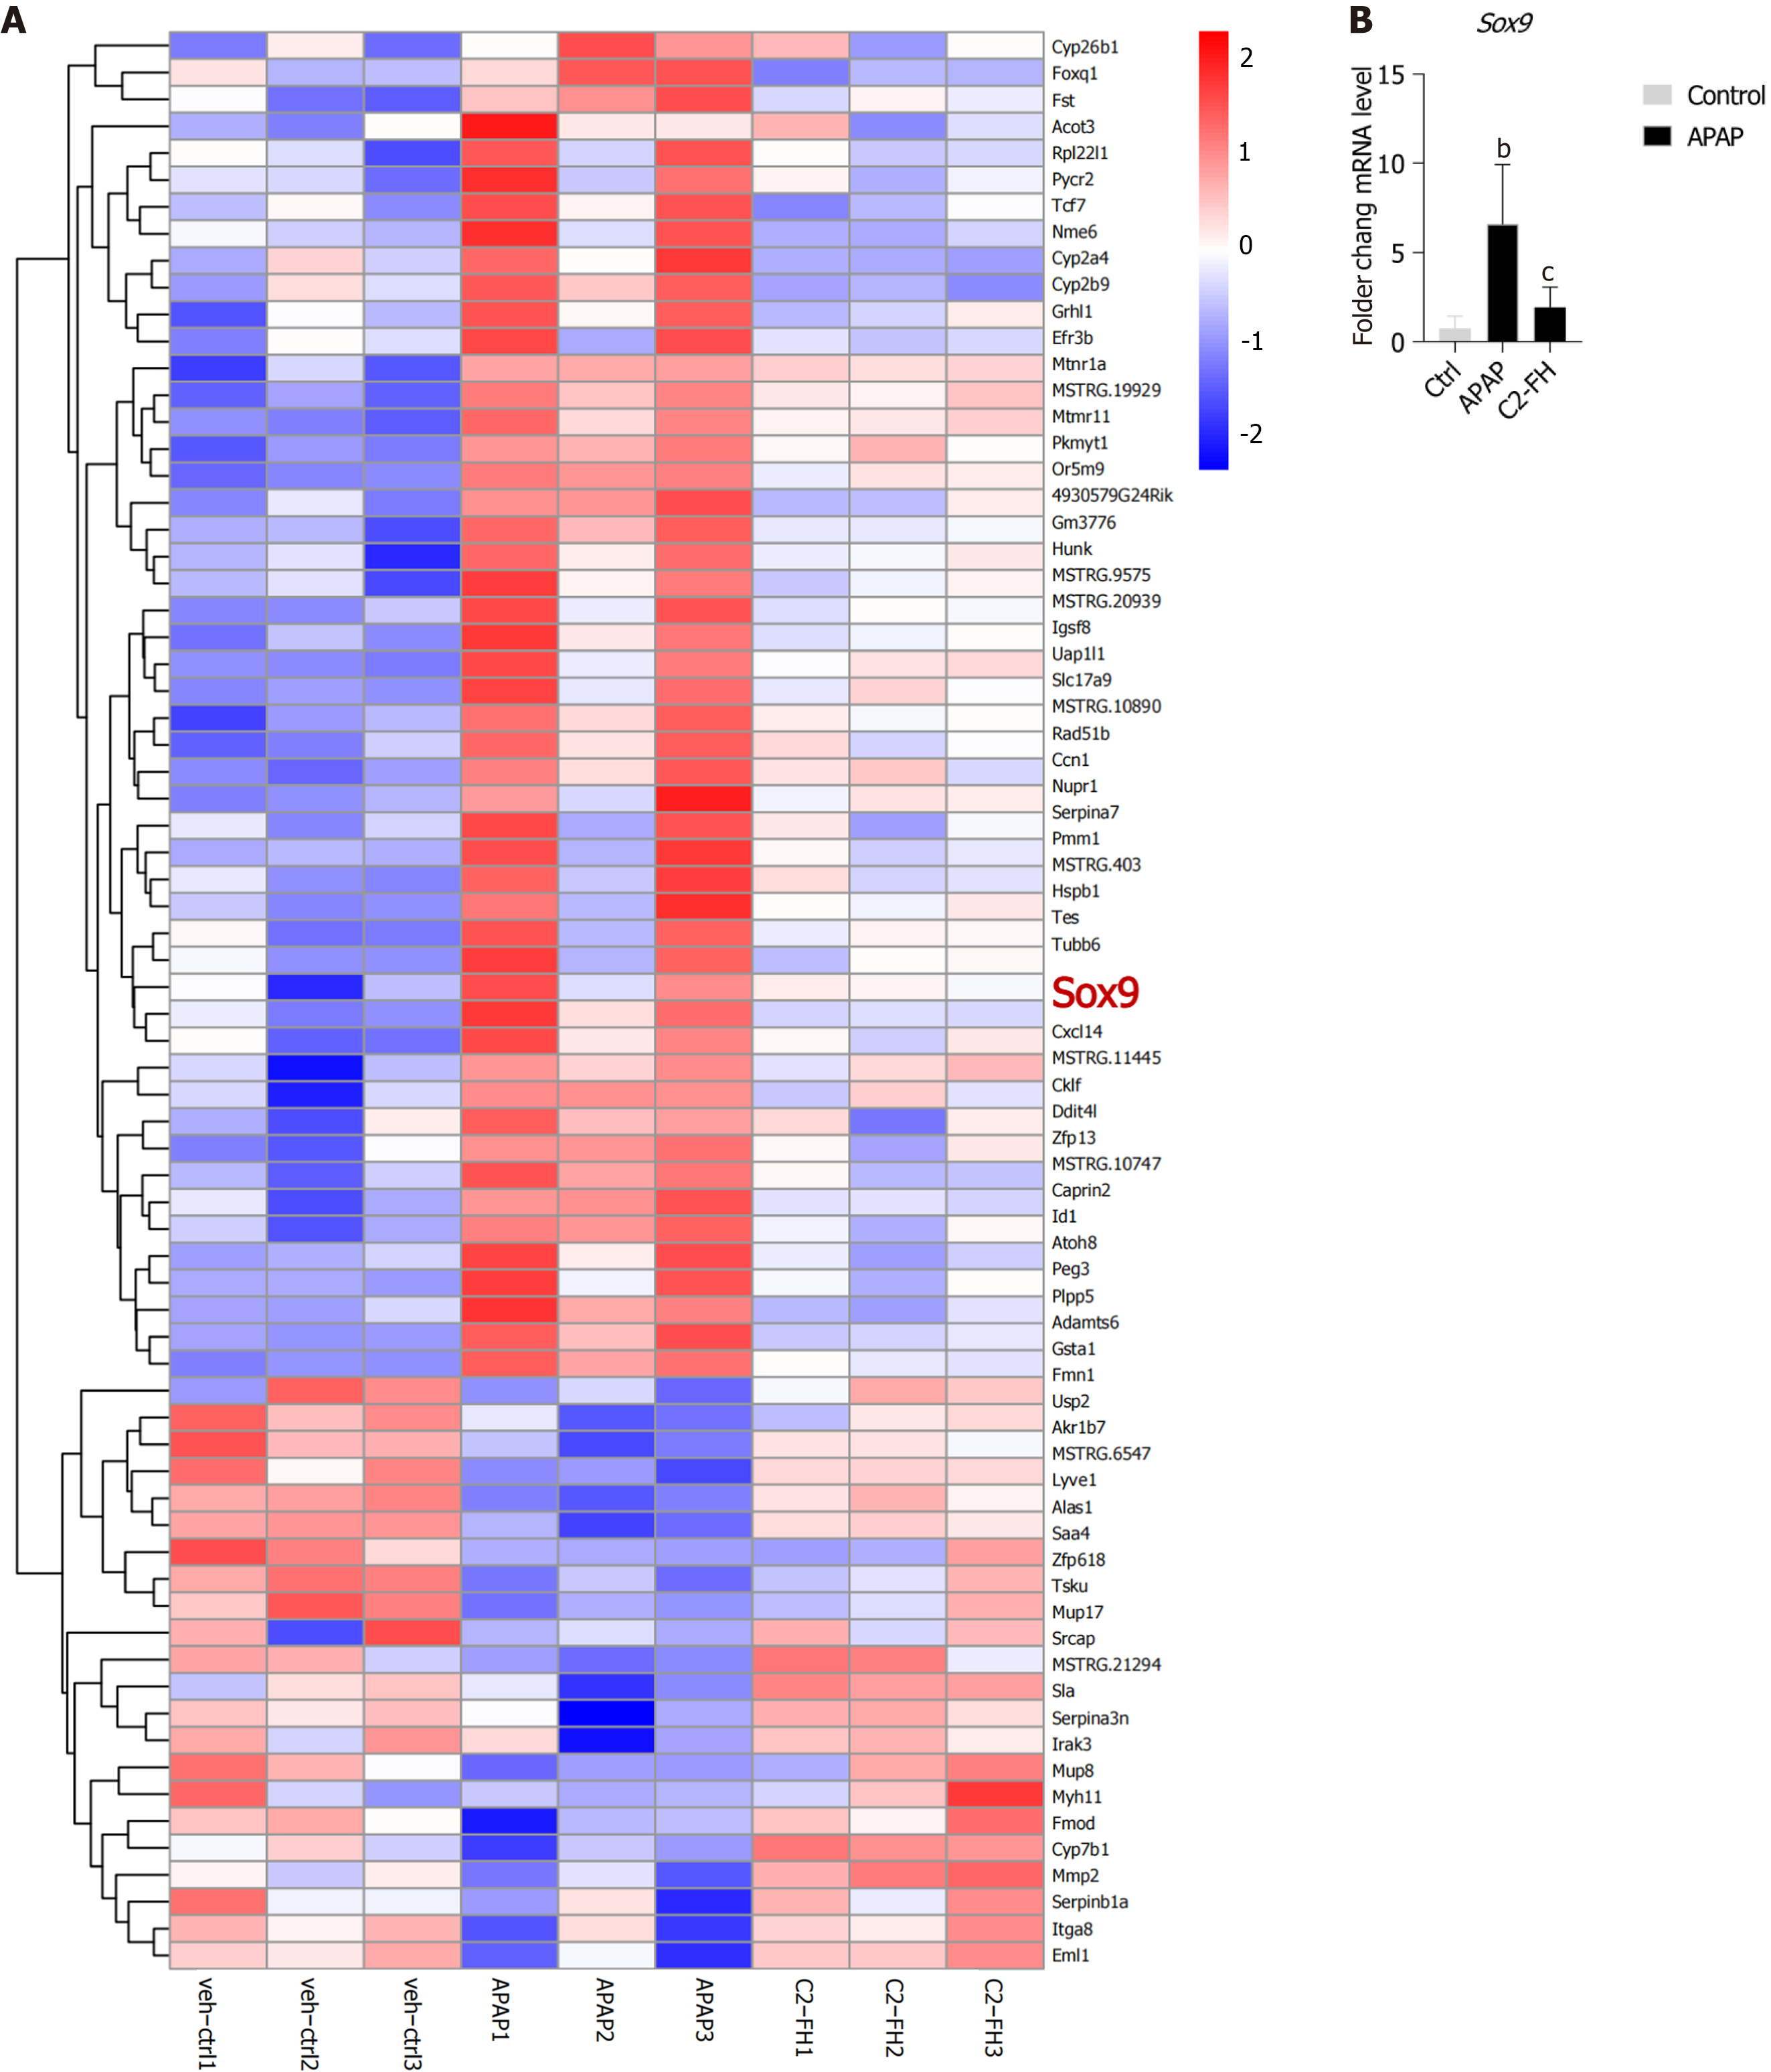
Figure 6 Heat map showing differentially expressed genes.
A: Heat map illustrating differentially expressed genes in the control, acetaminophen and C2-FH groups. Upregulated genes were indicated in red, while downregulated genes were indicated in blue. n = 3 per group; B: mRNA expression of Sox9. n = 4/5 per group. bP < 0.01 Ctrl vs APAP group. cP < 0.001 APAP vs C2-FH group. APAP: Acetaminophen.
- Citation: Li CM, Sun T, Yang MJ, Yang Z, Li Q, Shi JL, Zhang C, Jin JF. Complement activation targeted inhibitor C2-FH ameliorates acetaminophen-induced liver injury in mice. World J Hepatol 2024; 16(10): 1188-1198
- URL: https://www.wjgnet.com/1948-5182/full/v16/i10/1188.htm
- DOI: https://dx.doi.org/10.4254/wjh.v16.i10.1188


