Copyright
©The Author(s) 2024.
World J Hepatol. Oct 27, 2024; 16(10): 1188-1198
Published online Oct 27, 2024. doi: 10.4254/wjh.v16.i10.1188
Published online Oct 27, 2024. doi: 10.4254/wjh.v16.i10.1188
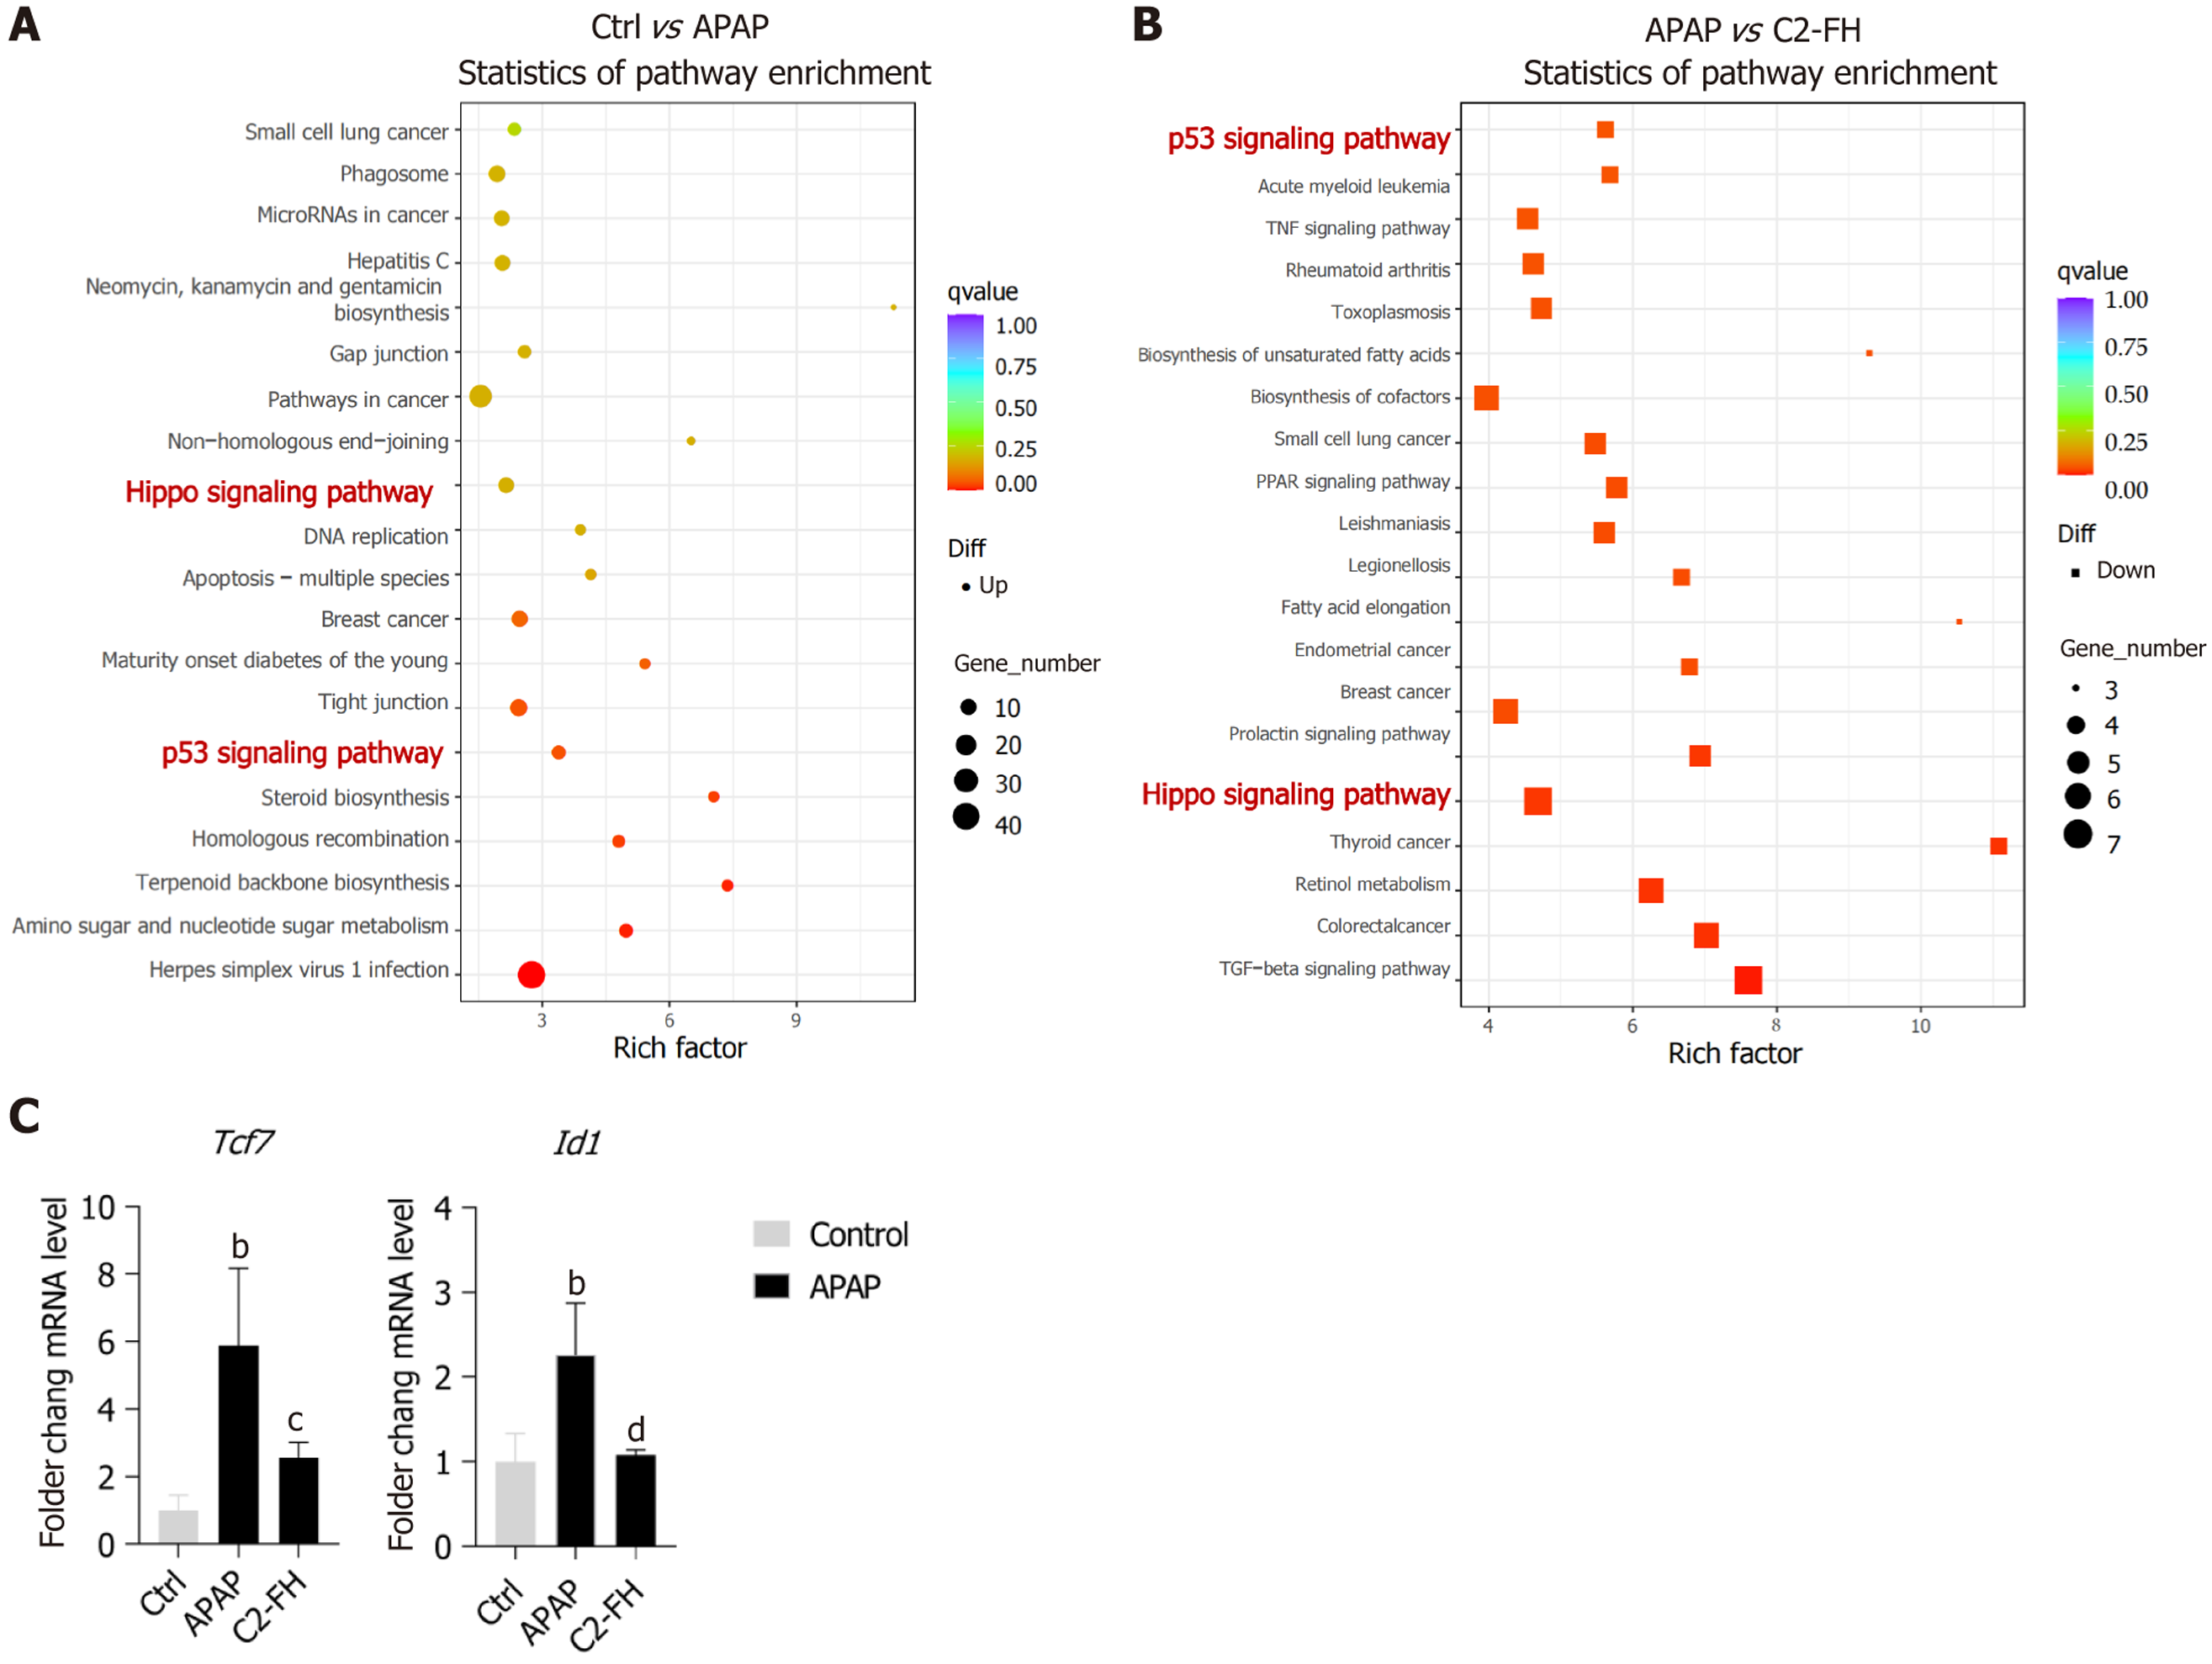
Figure 5 Kyoto encyclopedia of genes and genomes pathway enrichment analysis on differentially expressed genes.
A: Comparing acetaminophen (APAP) group with control group, a scatter plot displays the enrichment of Kyoto encyclopedia of genes and genomes (KEGG) pathways in the upregulated genes; B: Scatter plot of KEGG pathway enrichment of downregulated genes in the C2-FH group compared with the APAP group. Circles or boxes were used to represent upregulated or downregulated genes, respectively. The size of the circle or box is proportional to the number of genes enriched in the pathway, with larger circles indicating a higher number of genes. n = 3 per group; C: mRNA expression of Tcf7 and Id1. n = 4/5 per group. bP < 0.001 Ctrl vs APAP group. cP< 0.01, dP < 0.001 APAP vs C2-FH group. APAP: Acetaminophen.
- Citation: Li CM, Sun T, Yang MJ, Yang Z, Li Q, Shi JL, Zhang C, Jin JF. Complement activation targeted inhibitor C2-FH ameliorates acetaminophen-induced liver injury in mice. World J Hepatol 2024; 16(10): 1188-1198
- URL: https://www.wjgnet.com/1948-5182/full/v16/i10/1188.htm
- DOI: https://dx.doi.org/10.4254/wjh.v16.i10.1188


