Copyright
©The Author(s) 2024.
World J Hepatol. Oct 27, 2024; 16(10): 1188-1198
Published online Oct 27, 2024. doi: 10.4254/wjh.v16.i10.1188
Published online Oct 27, 2024. doi: 10.4254/wjh.v16.i10.1188
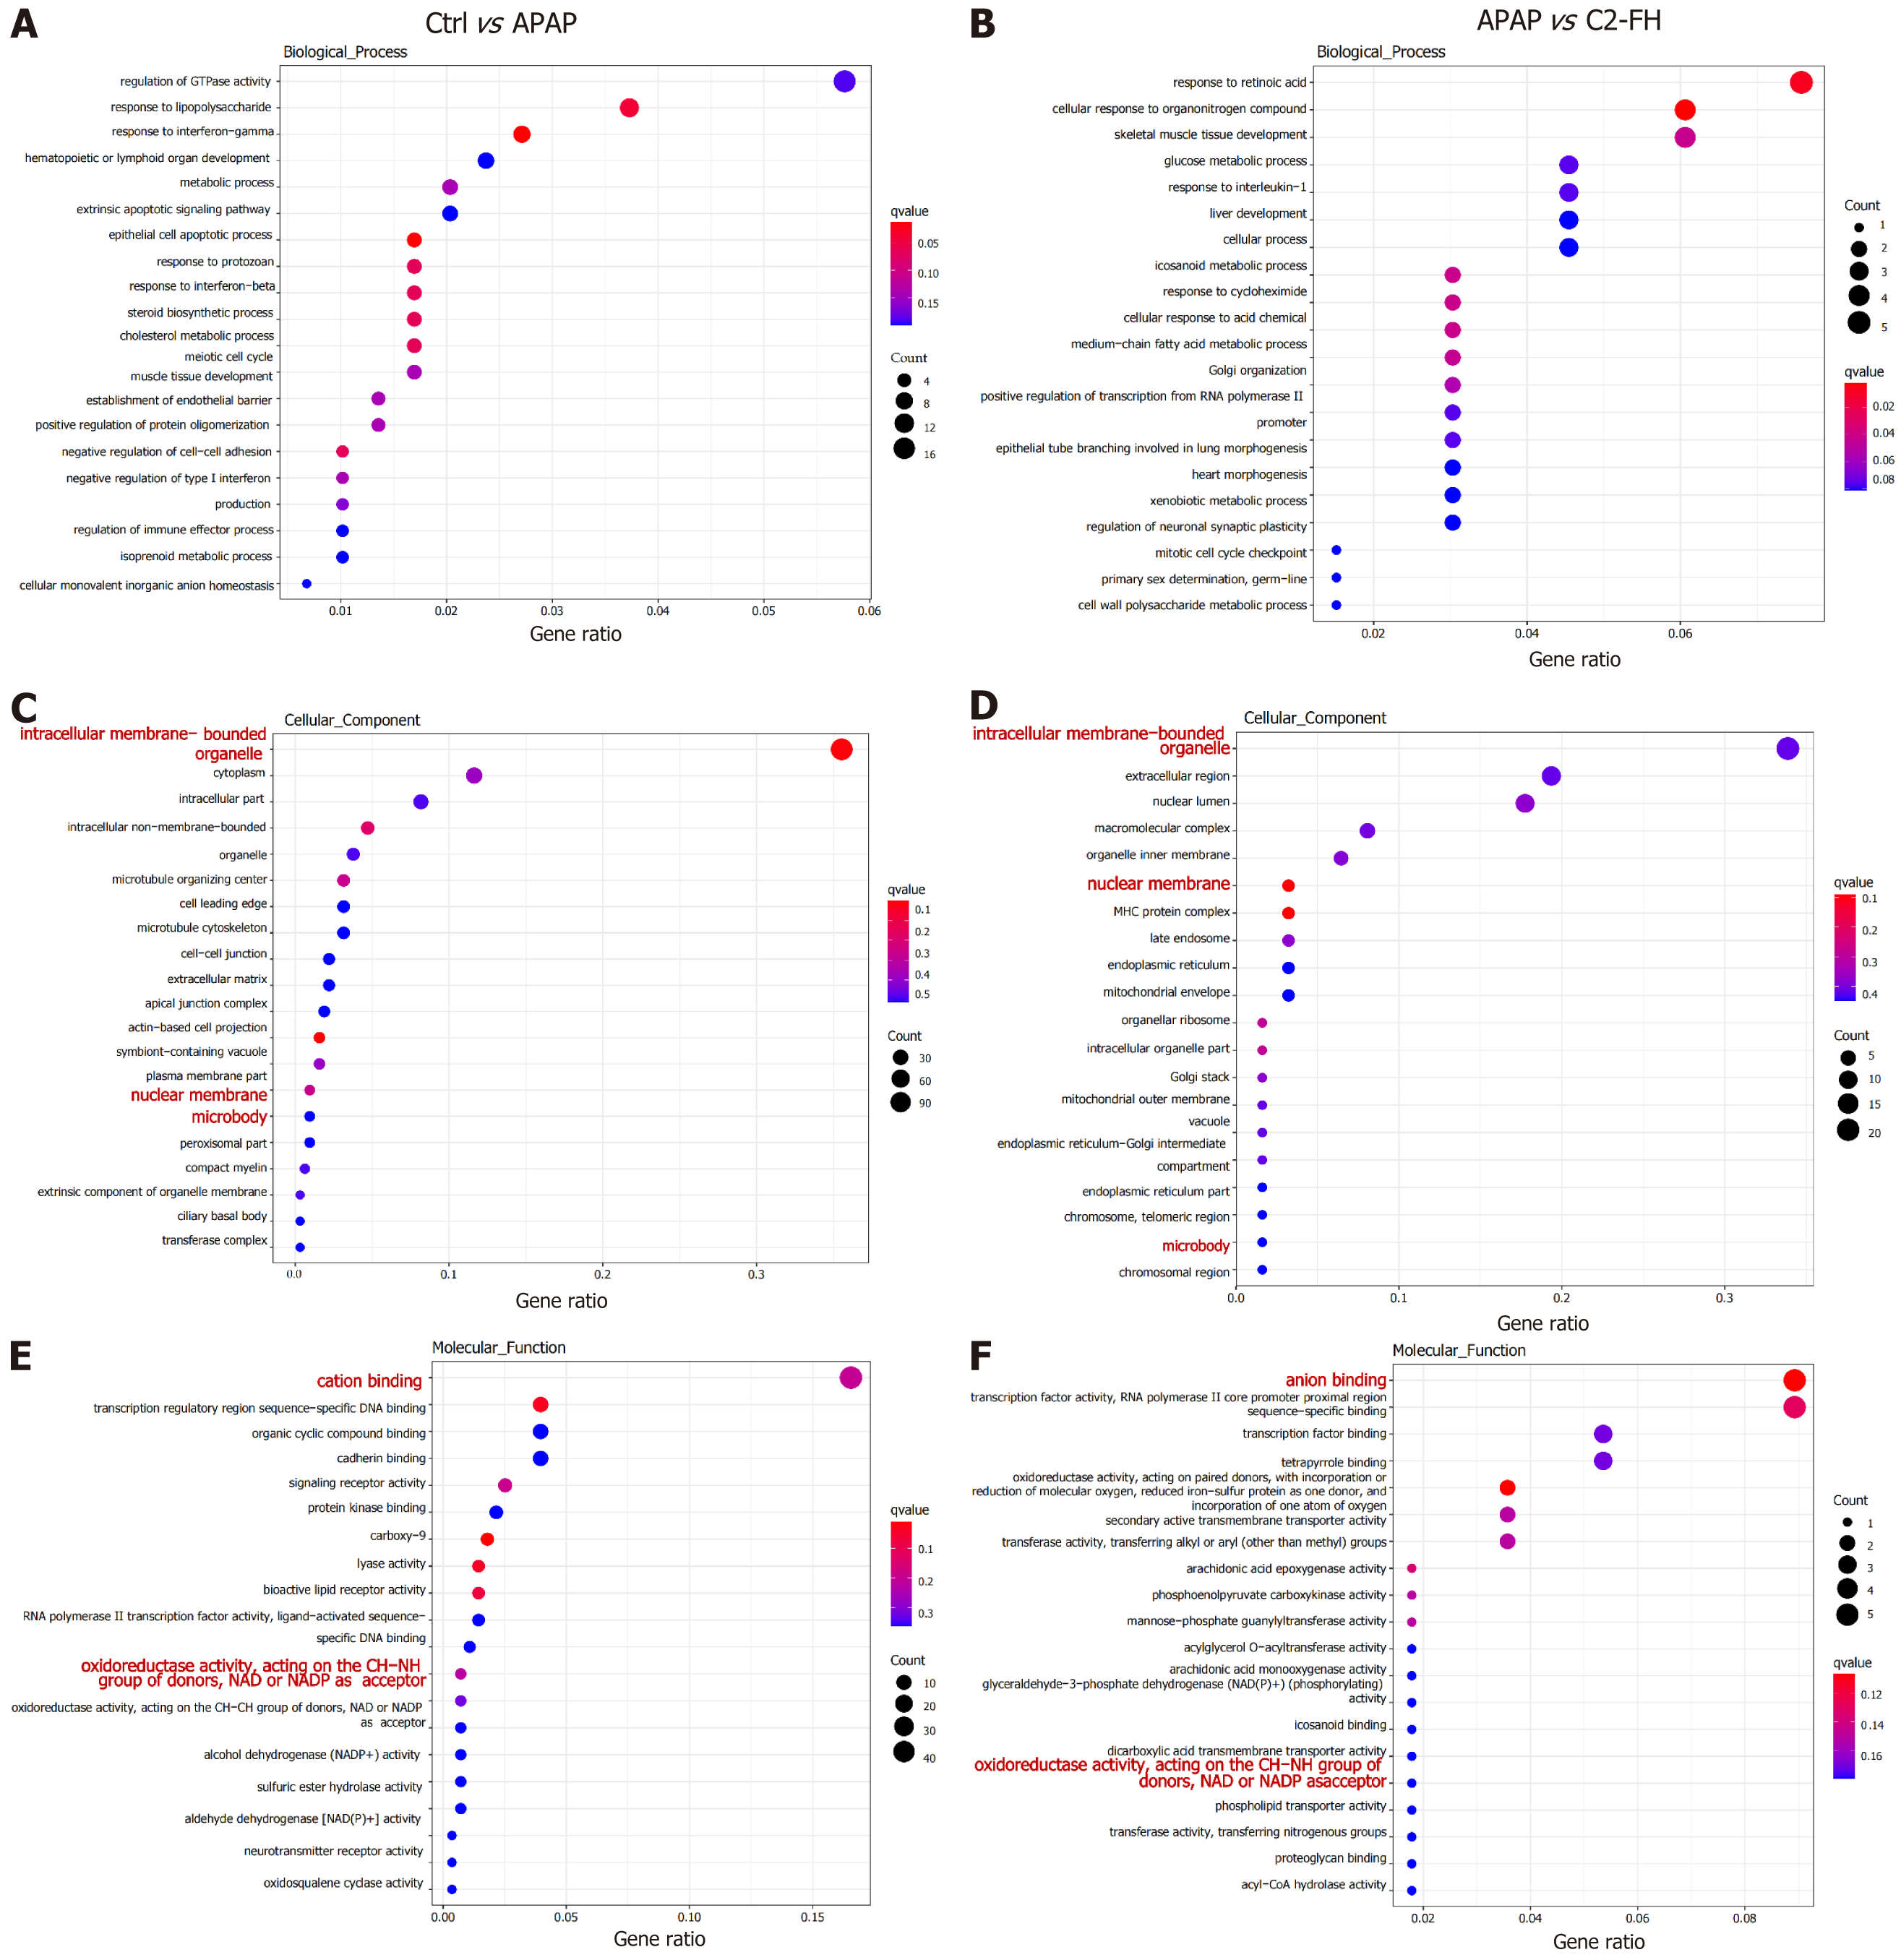
Figure 4 Performing gene ontology enrichment analysis on differentially expressed genes.
A: Bubble diagram in the acetaminophen (APAP) group represented the enriched biological processes (BPs) of upregulated genes compared with the Ctrl group; B: Bubble diagram in the C2-FH group represented the enriched BPs of downregulated genes compared with the APAP group; C: Bubble diagram in the APAP group represented the enriched cellular components (CCs) of upregulated genes compared with the Ctrl group; D: Bubble diagram in the C2-FH group represented the enriched CCs of downregulated genes compared with the APAP group; E: Bubble diagram in the APAP group represented the enriched molecular functions (MFs) of upregulated genes compared with the Ctrl group; F: Bubble diagram in the C2-FH group represented the enriched MFs of downregulated genes compared with the APAP group. n = 3 per group. APAP: Acetaminophen.
- Citation: Li CM, Sun T, Yang MJ, Yang Z, Li Q, Shi JL, Zhang C, Jin JF. Complement activation targeted inhibitor C2-FH ameliorates acetaminophen-induced liver injury in mice. World J Hepatol 2024; 16(10): 1188-1198
- URL: https://www.wjgnet.com/1948-5182/full/v16/i10/1188.htm
- DOI: https://dx.doi.org/10.4254/wjh.v16.i10.1188


