Copyright
©The Author(s) 2024.
World J Hepatol. Jan 27, 2024; 16(1): 65-74
Published online Jan 27, 2024. doi: 10.4254/wjh.v16.i1.65
Published online Jan 27, 2024. doi: 10.4254/wjh.v16.i1.65
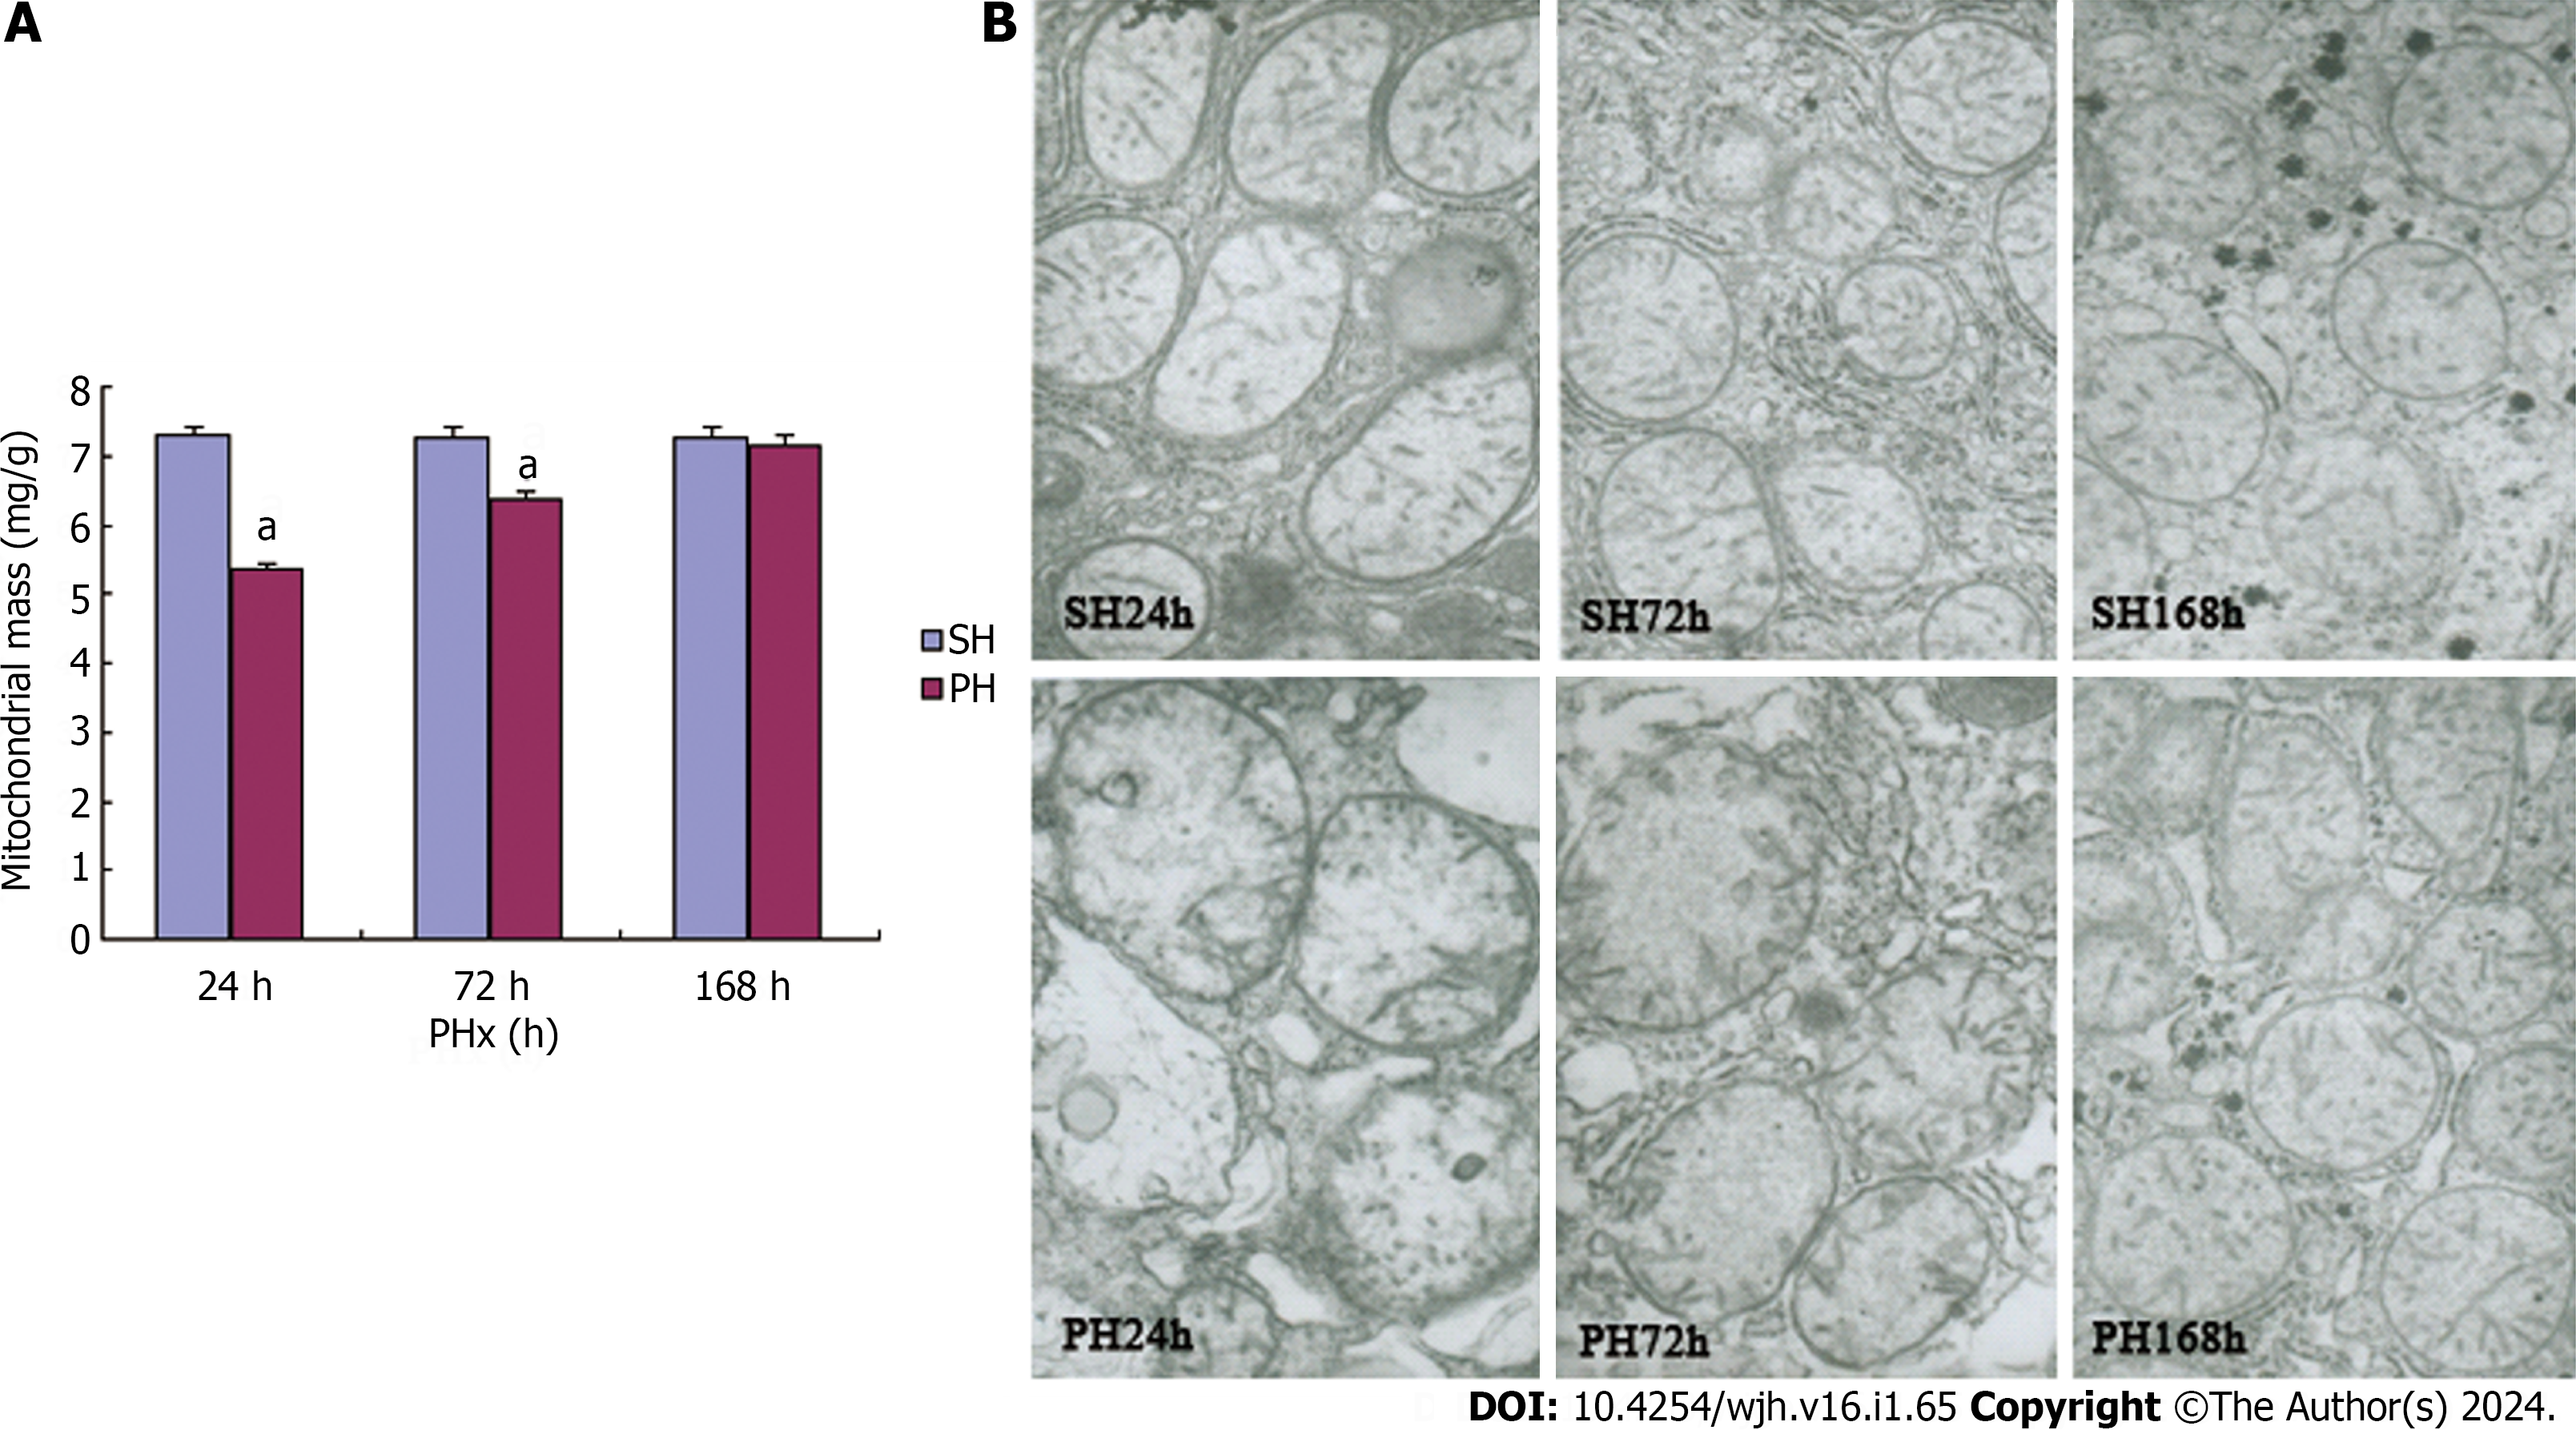
Figure 3 Mitochondrial mass and ultrastructural alterations during liver regeneration.
A: Changes of mitochondrial mass during liver regeneration (LR). Mitochondrial mass was measured by examining the protein contents of mitochondrial fractions extracted from the same weight (1 g) liver tissues of each experimental group; B: Electron micrographs of mitochondria in liver tissues during LR. Three maps in the upper panel are detail of hepatocytes in control groups, showing normal mitochondria. The other three maps in the bottom panel are detail of hepatocytes after 70% PHx, showing altered mitochondria during LR. PH: 70% PHx test groups; PHx: Partial hepatectomy; SH: Sham-operation control groups; PH: 70% PHx test groups. Ten randomly selected electron micrographs of the same magnification (15 000×) were examined from one hepatic lobule of five rats for each experimental group.
- Citation: Sun QJ, Liu T. Subcellular distribution of prohibitin 1 in rat liver during liver regeneration and its cellular implication. World J Hepatol 2024; 16(1): 65-74
- URL: https://www.wjgnet.com/1948-5182/full/v16/i1/65.htm
- DOI: https://dx.doi.org/10.4254/wjh.v16.i1.65


