Copyright
©The Author(s) 2023.
World J Hepatol. Nov 27, 2023; 15(11): 1237-1249
Published online Nov 27, 2023. doi: 10.4254/wjh.v15.i11.1237
Published online Nov 27, 2023. doi: 10.4254/wjh.v15.i11.1237
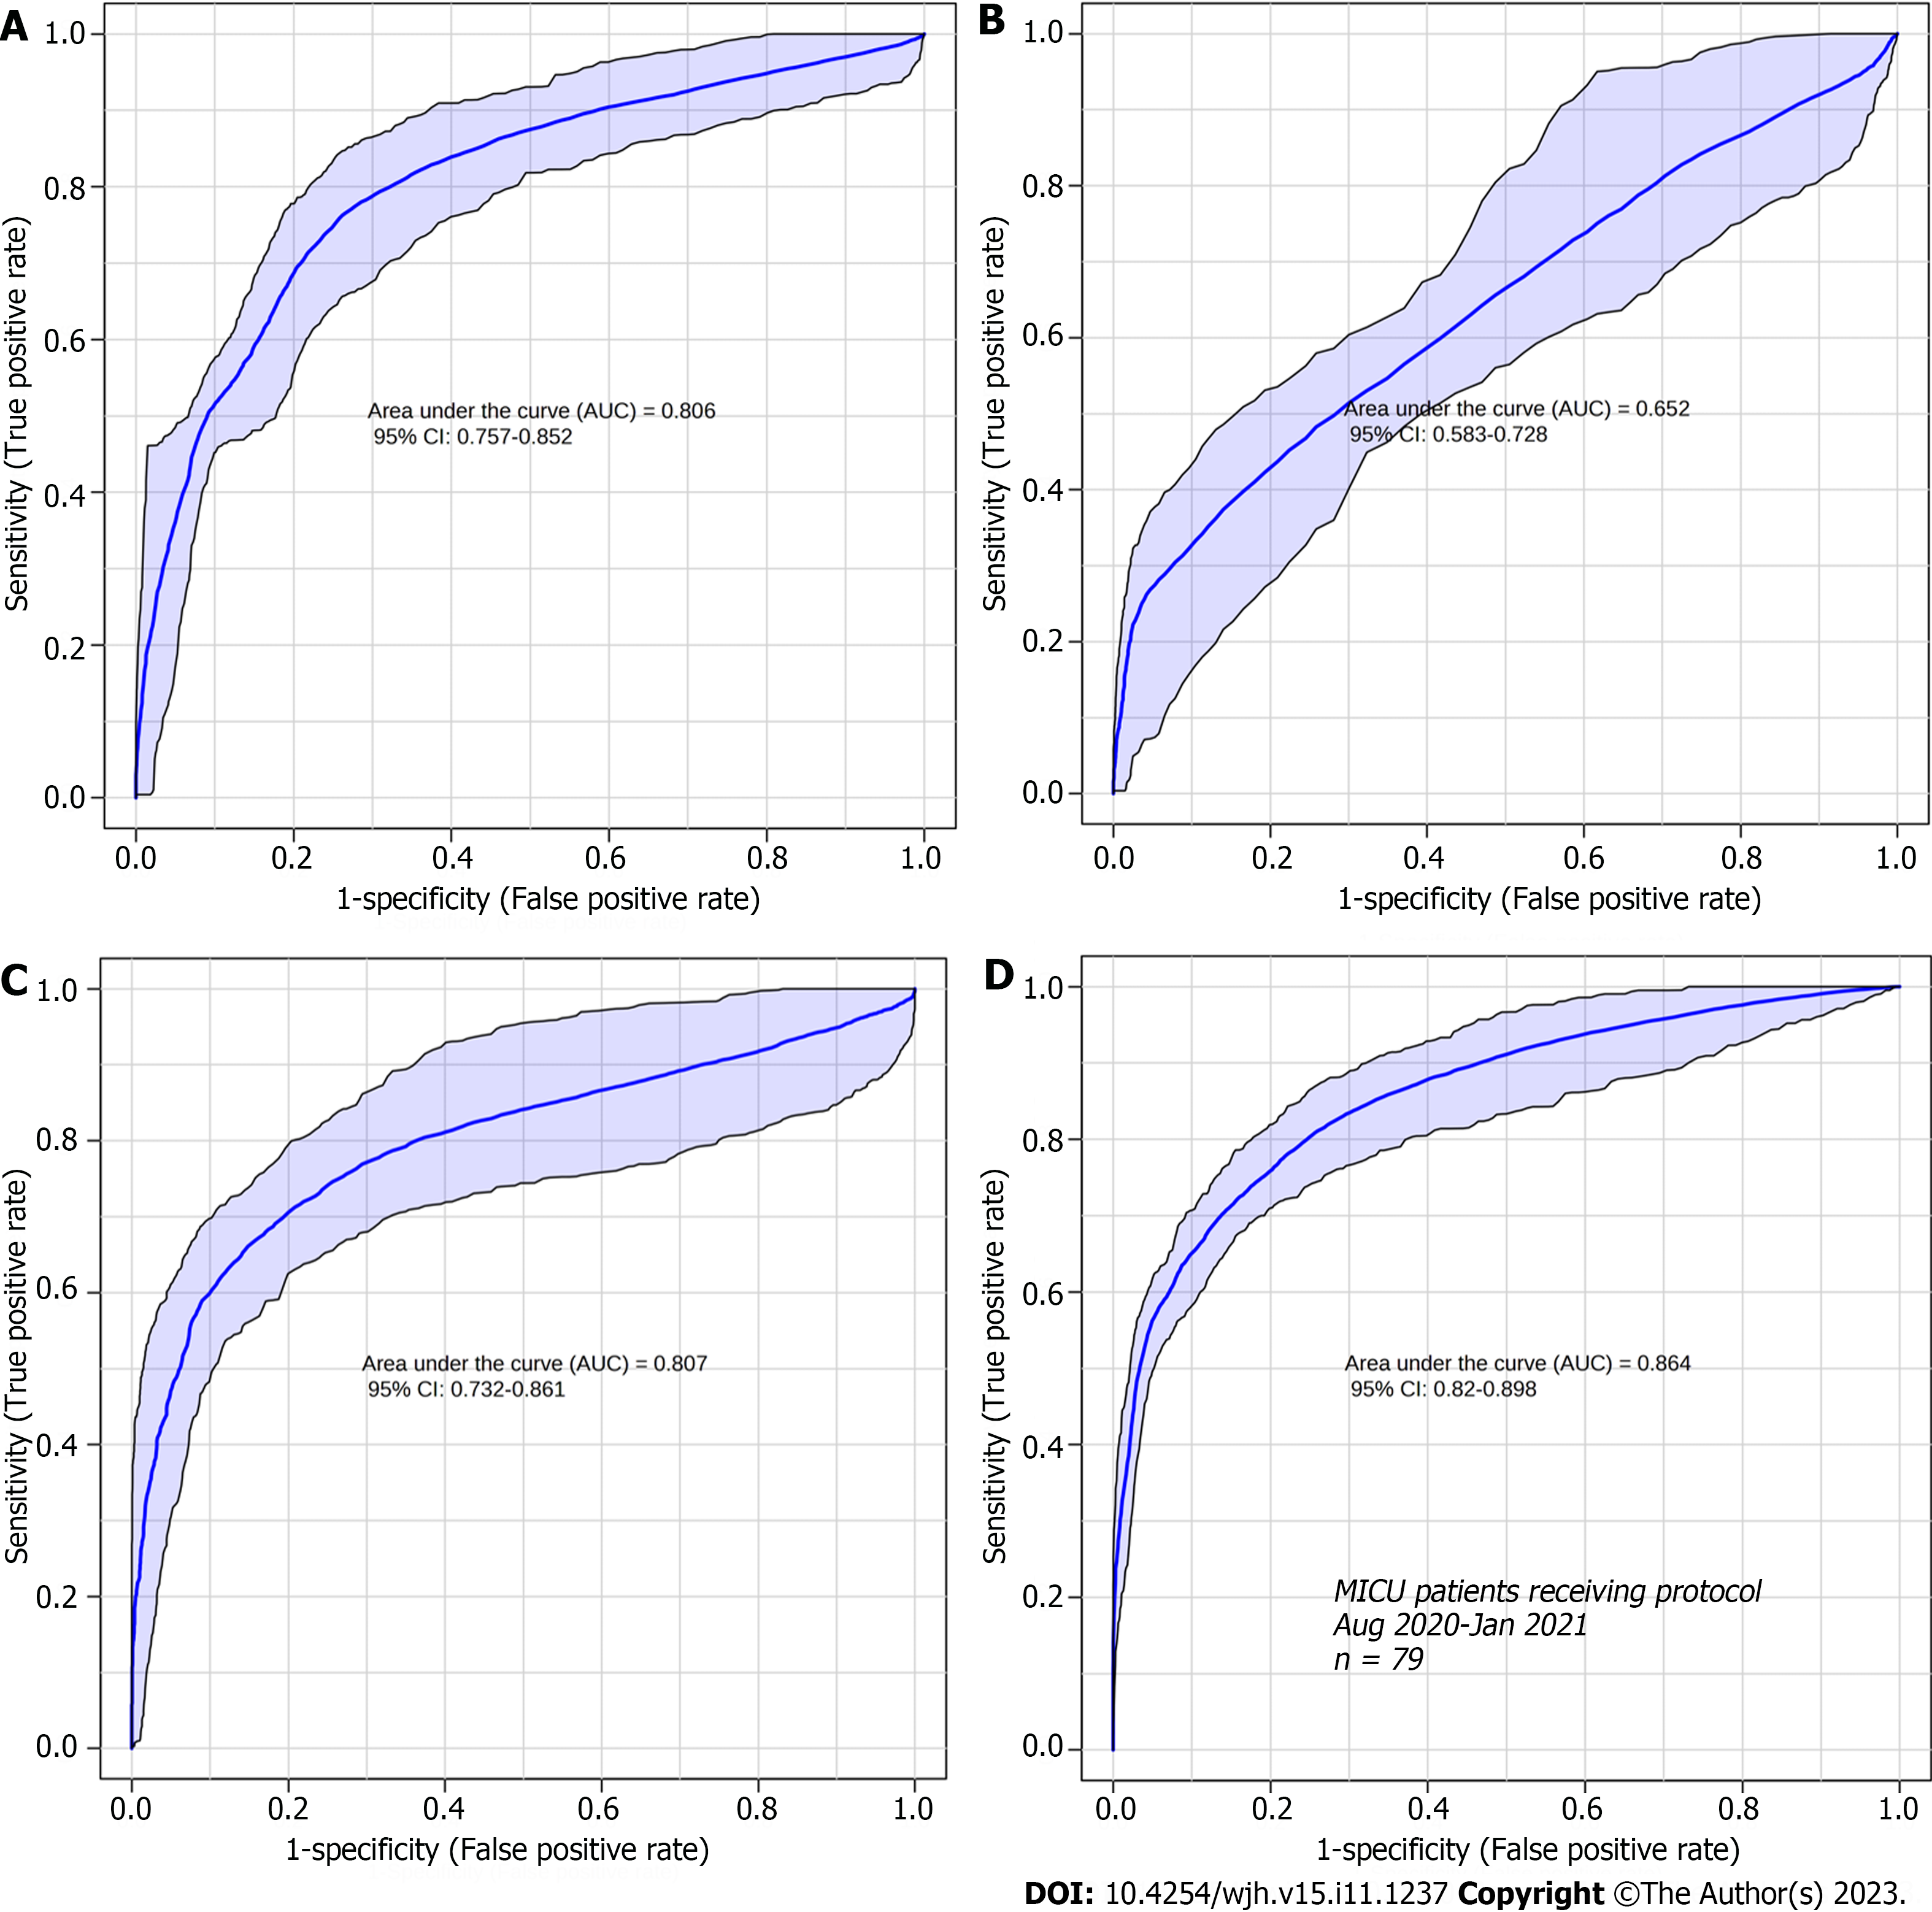
Figure 5 Receiver operating characteristic curve analysis of the sets of metabolites identified at each fibrosis grade.
A: Receiver operating characteristic (ROC) curve analysis of the set of differential metabolites identified in F1 compared to the other grades (F2, F3, and F4); B: ROC curve analysis of the set of differential metabolites identified in F2 compared to the other grades (F1, F3, and F4); C: ROC curve analysis of the set of differential metabolites identified in F3 compared to the other grades (F1, F2, and F4); D: ROC curve analysis of the set of differential metabolites identified in F4 compared to the other grades (F1, F2, and F3).
- Citation: Ferrasi AC, Lima SVG, Galvani AF, Delafiori J, Dias-Audibert FL, Catharino RR, Silva GF, Praxedes RR, Santos DB, Almeida DTM, Lima EO. Metabolomics in chronic hepatitis C: Decoding fibrosis grading and underlying pathways. World J Hepatol 2023; 15(11): 1237-1249
- URL: https://www.wjgnet.com/1948-5182/full/v15/i11/1237.htm
- DOI: https://dx.doi.org/10.4254/wjh.v15.i11.1237


