Copyright
©The Author(s) 2023.
World J Hepatol. Nov 27, 2023; 15(11): 1237-1249
Published online Nov 27, 2023. doi: 10.4254/wjh.v15.i11.1237
Published online Nov 27, 2023. doi: 10.4254/wjh.v15.i11.1237
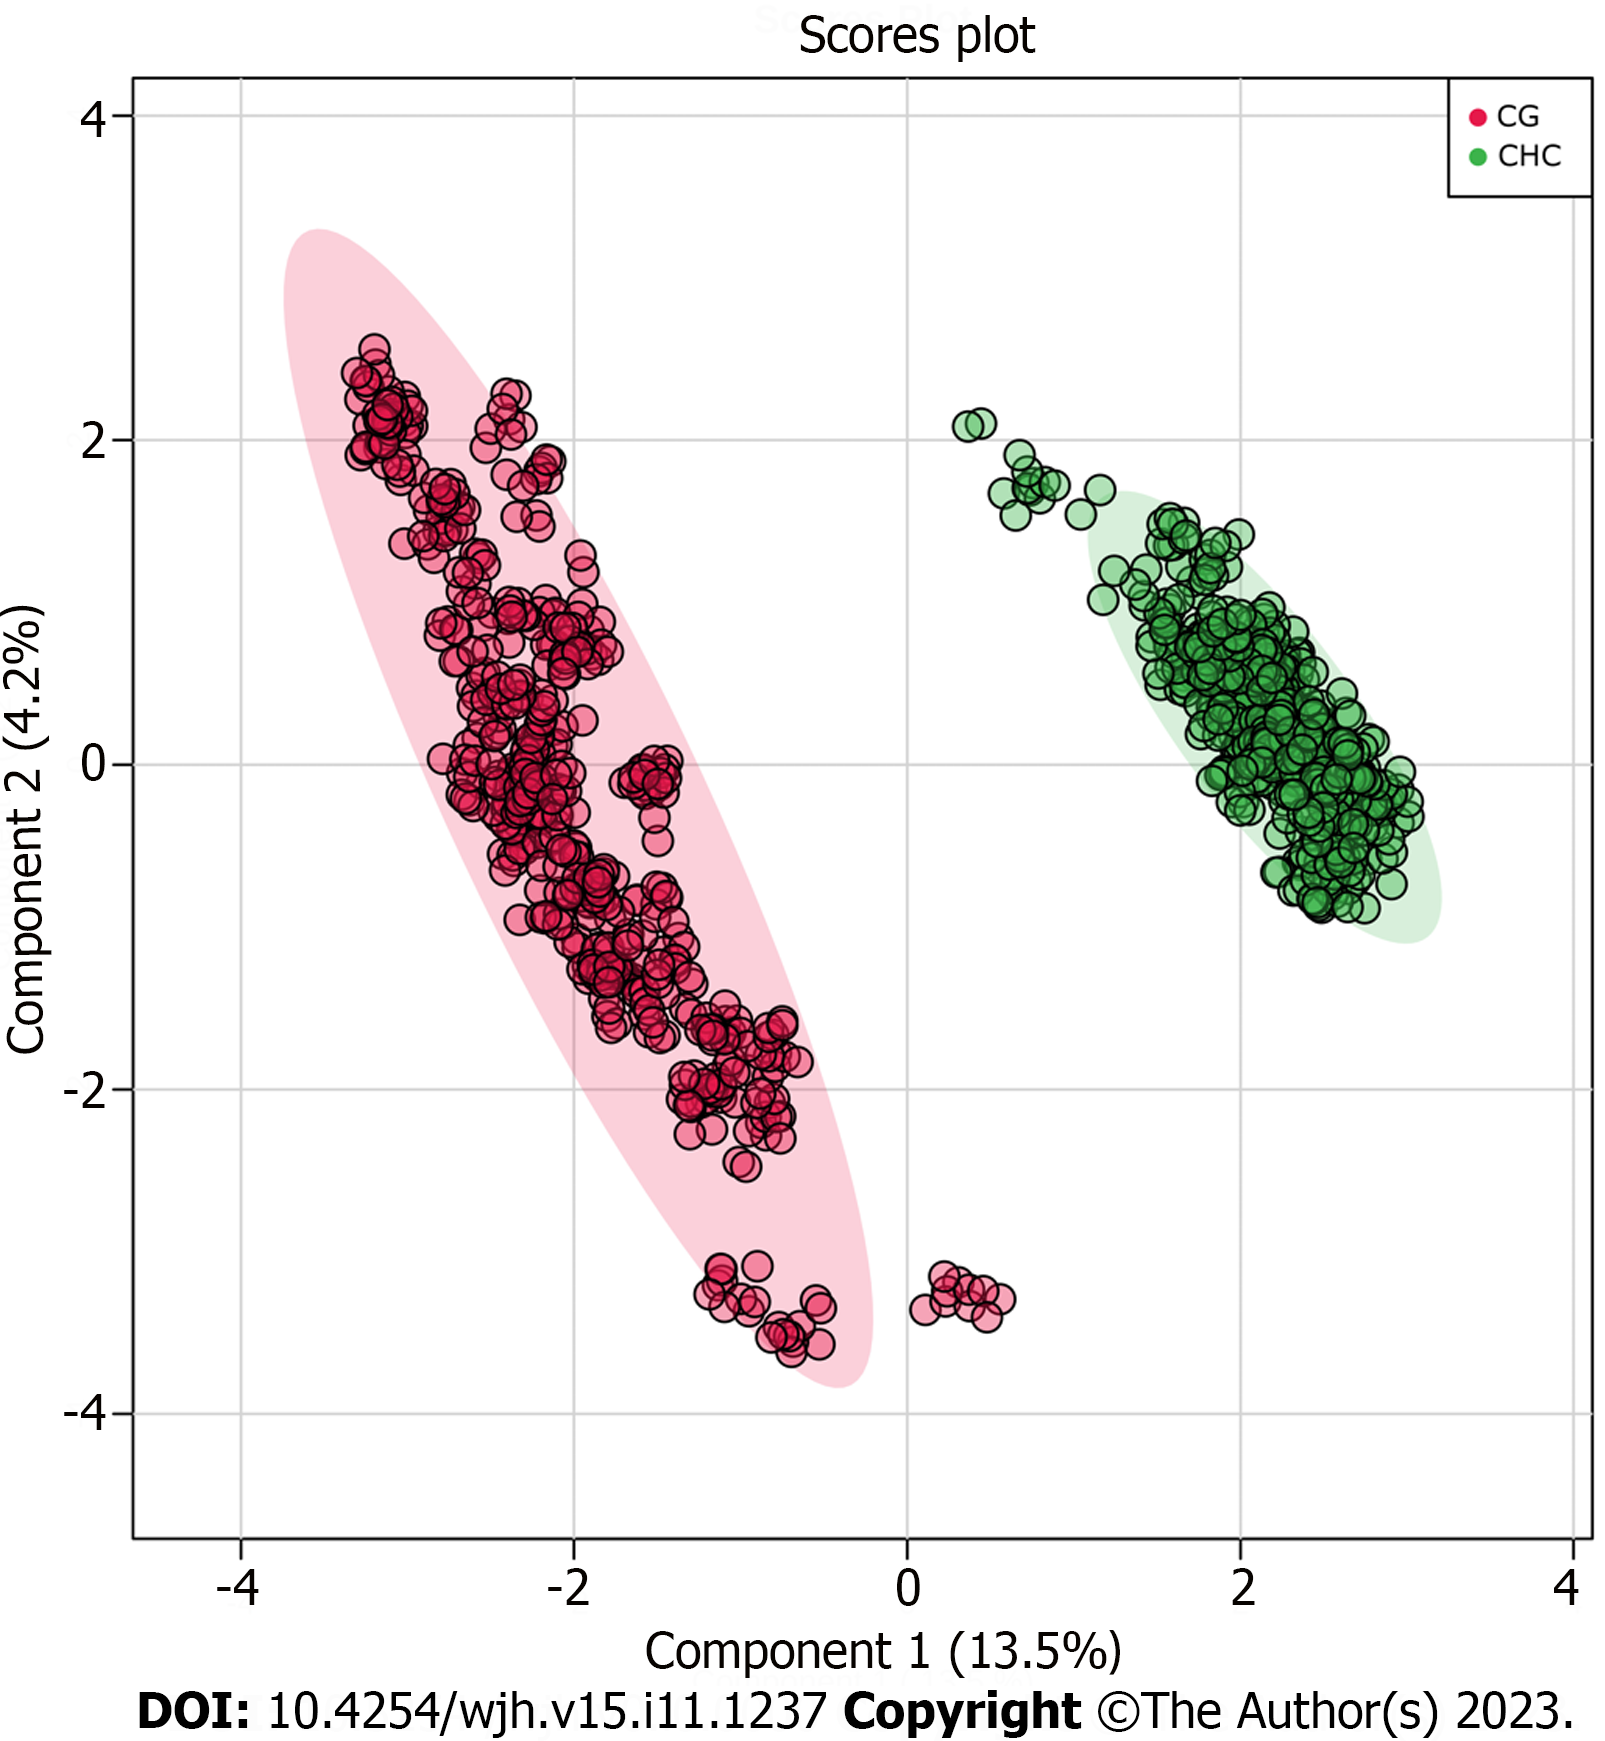
Figure 3 Score plot generated from partial least squares discriminant analysis comparing the chronic hepatitis C vs healthy control groups.
Each group is highlighted by different colors: Healthy control groups (red dots) and chronic hepatitis C (green dots), where each dot represents one analytical replicate. The shaded regions around the points represent the 95% confidence interval for each group.
- Citation: Ferrasi AC, Lima SVG, Galvani AF, Delafiori J, Dias-Audibert FL, Catharino RR, Silva GF, Praxedes RR, Santos DB, Almeida DTM, Lima EO. Metabolomics in chronic hepatitis C: Decoding fibrosis grading and underlying pathways. World J Hepatol 2023; 15(11): 1237-1249
- URL: https://www.wjgnet.com/1948-5182/full/v15/i11/1237.htm
- DOI: https://dx.doi.org/10.4254/wjh.v15.i11.1237


