Copyright
©The Author(s) 2022.
World J Hepatol. Aug 27, 2022; 14(8): 1608-1620
Published online Aug 27, 2022. doi: 10.4254/wjh.v14.i8.1608
Published online Aug 27, 2022. doi: 10.4254/wjh.v14.i8.1608
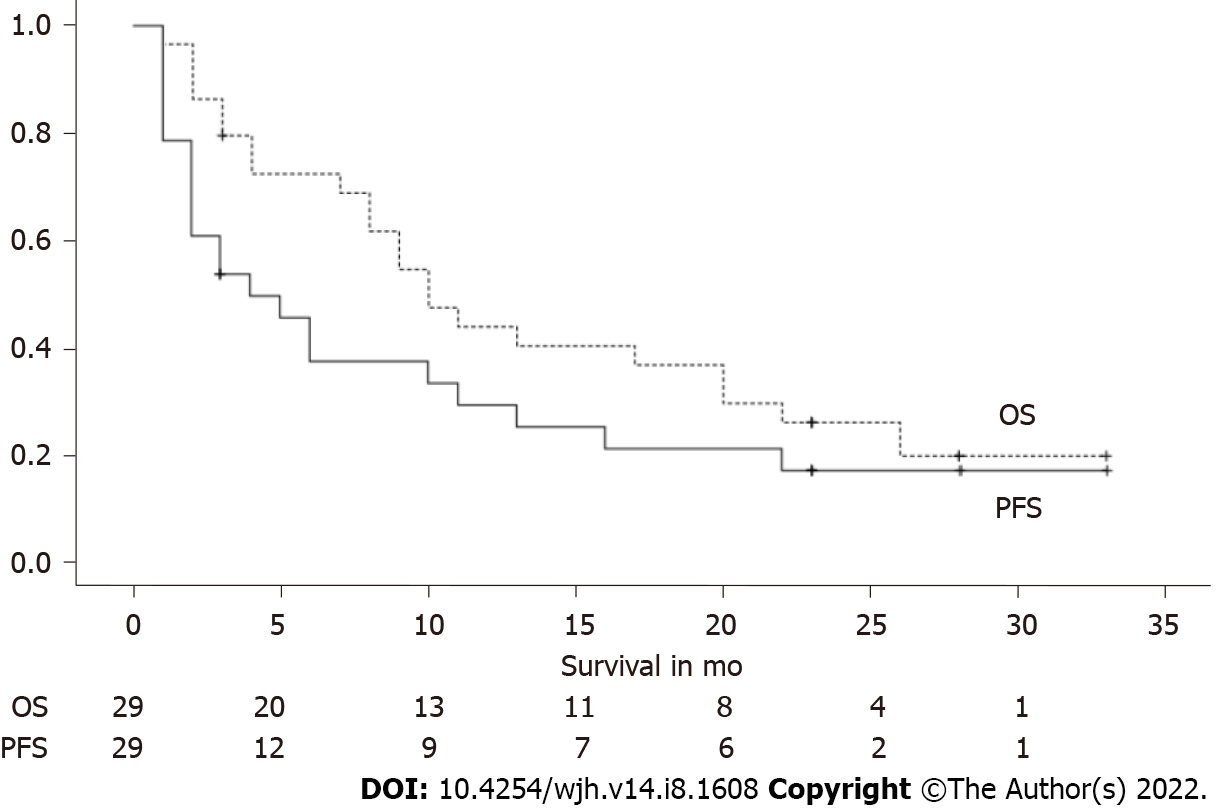
Figure 3 Overall and progression-free survival.
The graph shows the Kaplan-Meier survival curves for overall and progression-free survival. Below the graph the number of patients still alive at that time is depicted. OS: Overall survival; PFS: Progression-free survival.
- Citation: De Wilde N, Vonghia L, Francque S, De Somer T, Bagdadi A, Staub E, Lambrechts J, Bucalau AM, Verset G, Van Steenkiste C. Real-life multi-center retrospective analysis on nivolumab in difficult-to-treat patients with advanced hepatocellular carcinoma. World J Hepatol 2022; 14(8): 1608-1620
- URL: https://www.wjgnet.com/1948-5182/full/v14/i8/1608.htm
- DOI: https://dx.doi.org/10.4254/wjh.v14.i8.1608


