Copyright
©The Author(s) 2022.
World J Hepatol. Jul 27, 2022; 14(7): 1382-1397
Published online Jul 27, 2022. doi: 10.4254/wjh.v14.i7.1382
Published online Jul 27, 2022. doi: 10.4254/wjh.v14.i7.1382
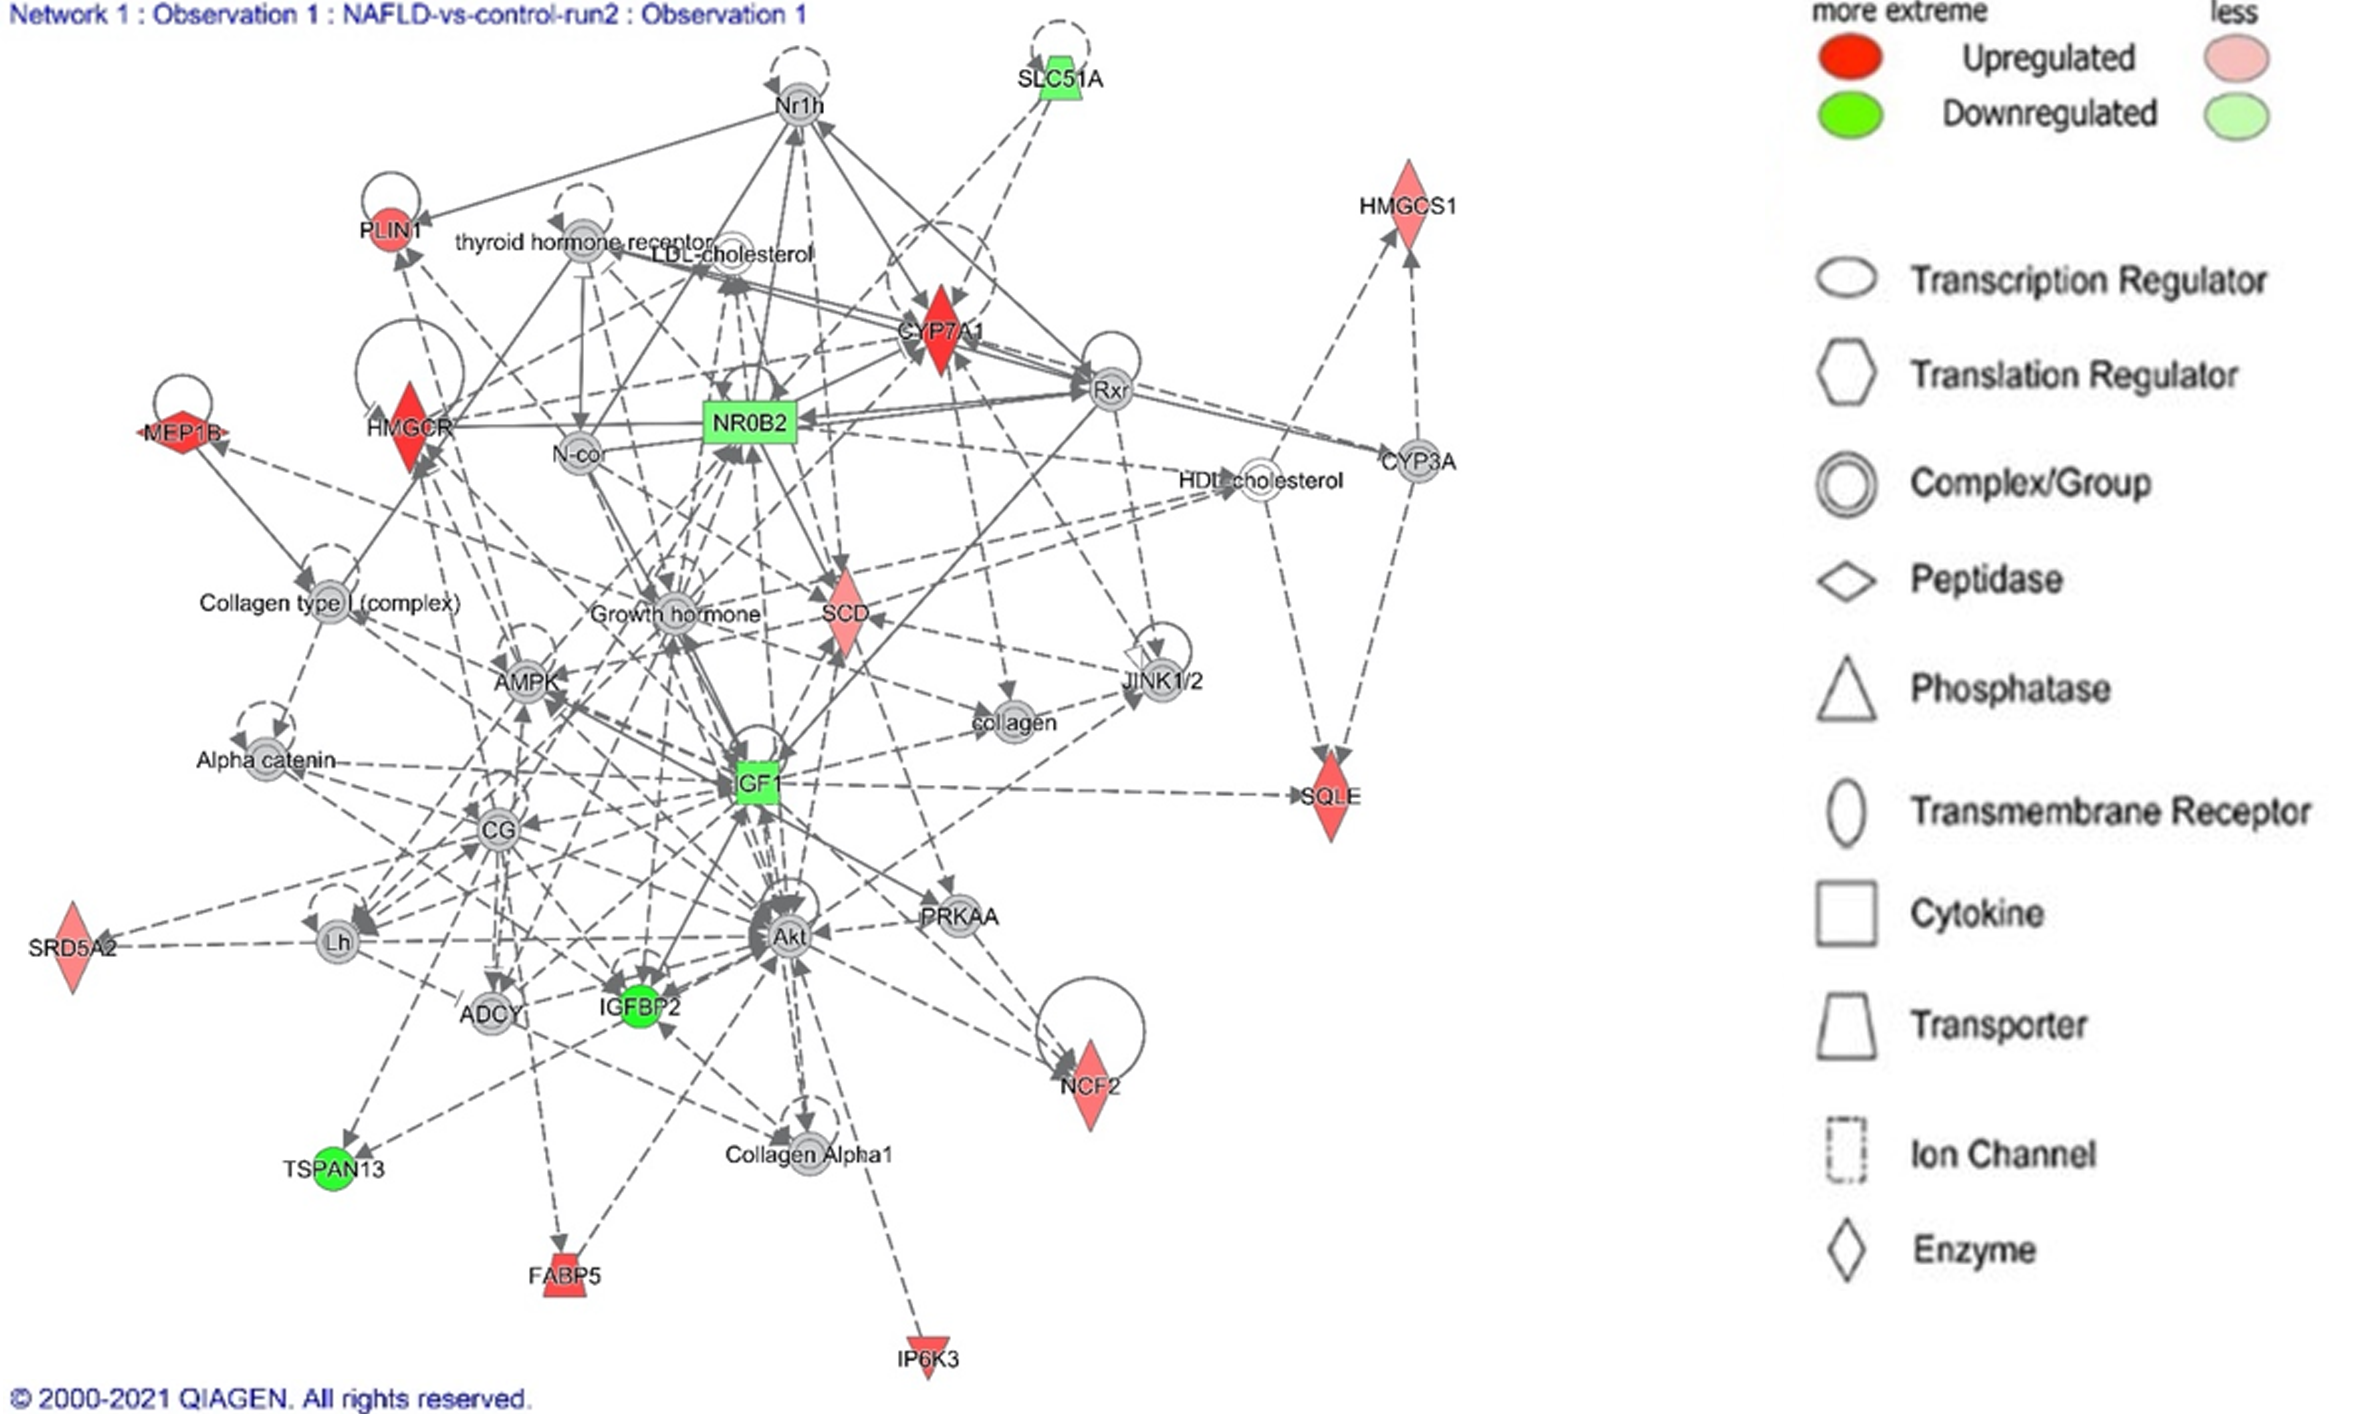
Figure 2 Top network (Lipid metabolism, small molecule biochemistry, vitamin and mineral metabolism) identified by Ingenuity Pathway Analysis Network analysis of non-alcoholic fatty liver disease.
Legend illustrates class of the gene. Red indicates upregulation and green downregulation, with shade depicting magnitude of change. Solid and dashed lines depict direct and indirect, respectively, relationship between genes. Figure generated using Ingenuity Pathway Analysis.
- Citation: Aljabban J, Rohr M, Syed S, Khorfan K, Borkowski V, Aljabban H, Segal M, Mukhtar M, Mohammed M, Panahiazar M, Hadley D, Spengler R, Spengler E. Transcriptome changes in stages of non-alcoholic fatty liver disease. World J Hepatol 2022; 14(7): 1382-1397
- URL: https://www.wjgnet.com/1948-5182/full/v14/i7/1382.htm
- DOI: https://dx.doi.org/10.4254/wjh.v14.i7.1382


