Copyright
©The Author(s) 2022.
World J Hepatol. Jul 27, 2022; 14(7): 1357-1364
Published online Jul 27, 2022. doi: 10.4254/wjh.v14.i7.1357
Published online Jul 27, 2022. doi: 10.4254/wjh.v14.i7.1357
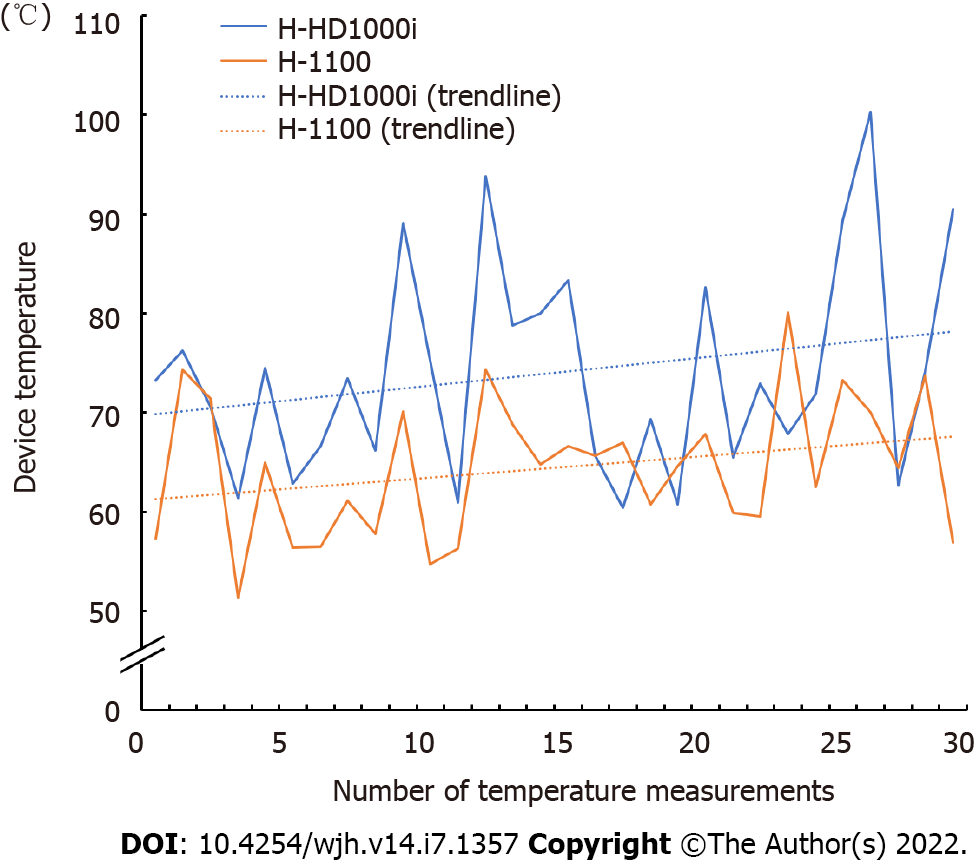
Figure 2 Representative trend in device temperature measured after every 10 consecutive activations, until 300 porcine liver dissections were performed.
H-HD1000i (blue, solid line) and H-1100 (orange, solid line) are shown. The equations of linear trend line are as follows: H-HD1000i (blue, dot line), y = 0.285x + 69.6; H-1100 (orange, dot line), y = 0.217x + 61.1.
- Citation: Kajiwara M, Fujikawa T, Hasegawa S. Tissue pad degradation of ultrasonic device may enhance thermal injury and impair its sealing performance in liver surgery. World J Hepatol 2022; 14(7): 1357-1364
- URL: https://www.wjgnet.com/1948-5182/full/v14/i7/1357.htm
- DOI: https://dx.doi.org/10.4254/wjh.v14.i7.1357


