Copyright
©The Author(s) 2022.
World J Hepatol. Jun 27, 2022; 14(6): 1131-1141
Published online Jun 27, 2022. doi: 10.4254/wjh.v14.i6.1131
Published online Jun 27, 2022. doi: 10.4254/wjh.v14.i6.1131
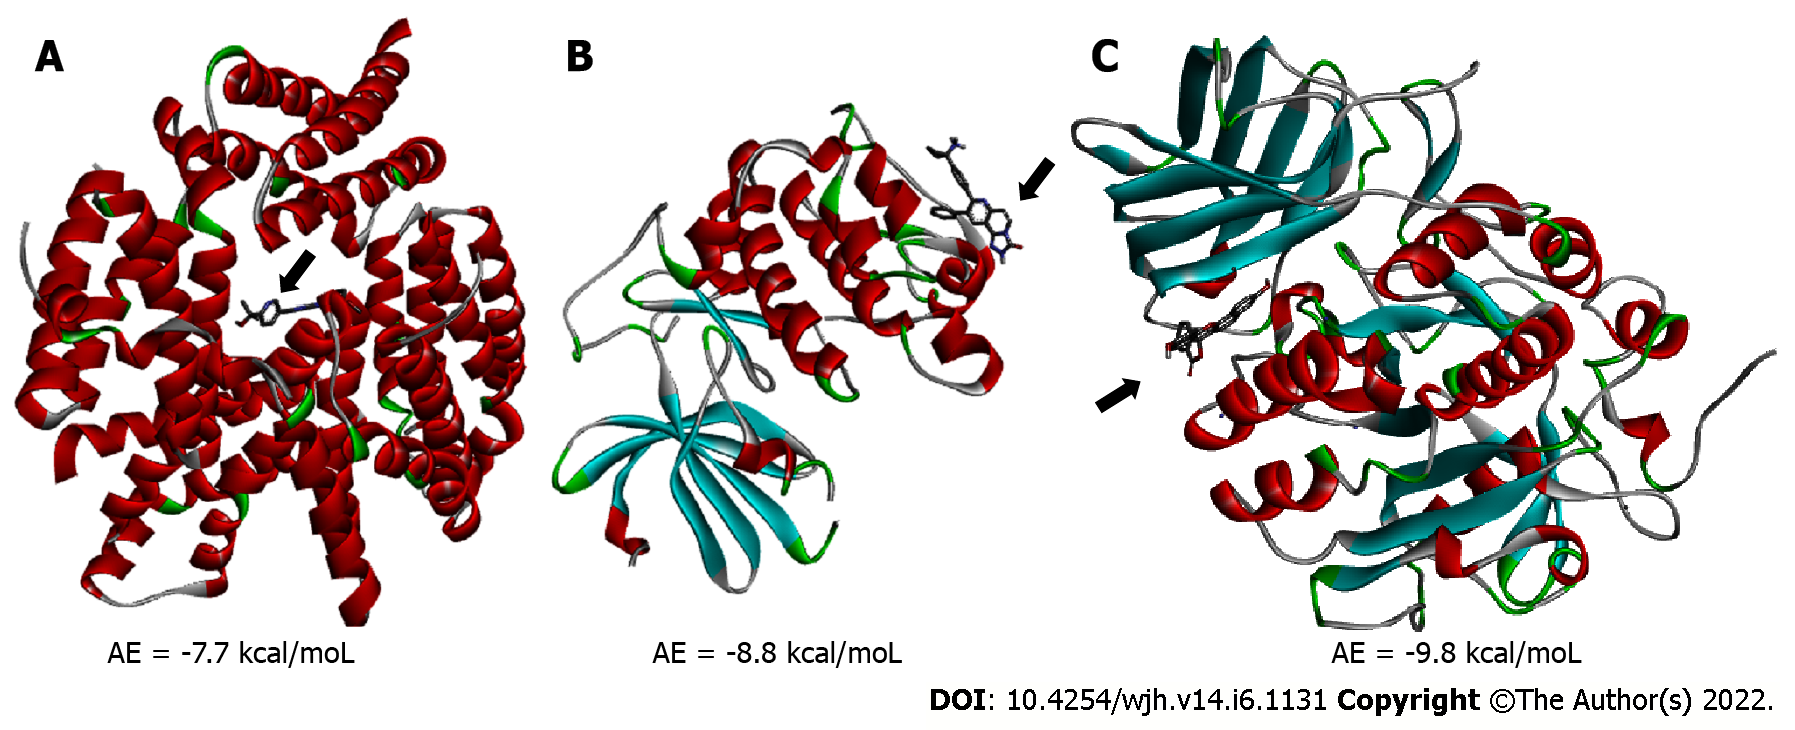
Figure 1 Panoramic view of the enzyme/inhibitor complexes.
A: mTORC1/CC-223 complex; B: Akt/MK-2206 complex; C: Furin/Naphthofluorescein complex. Arrow points to the inhibitor. Alpha helices are shown in red, Beta sheets are shown in blue, Random coils are shown in green and Turns are shown in grey. AE: Affinity energy.
- Citation: Peiter GC, de Souza CBT, de Oliveira LM, Pagliarin LG, dos Anjos VNF, da Silva FAF, de Melo FF, Teixeira KN. COVID-19 liver and gastroenterology findings: An in silico analysis of SARS-CoV-2 interactions with liver molecules. World J Hepatol 2022; 14(6): 1131-1141
- URL: https://www.wjgnet.com/1948-5182/full/v14/i6/1131.htm
- DOI: https://dx.doi.org/10.4254/wjh.v14.i6.1131


