Copyright
©The Author(s) 2022.
World J Hepatol. May 27, 2022; 14(5): 923-943
Published online May 27, 2022. doi: 10.4254/wjh.v14.i5.923
Published online May 27, 2022. doi: 10.4254/wjh.v14.i5.923
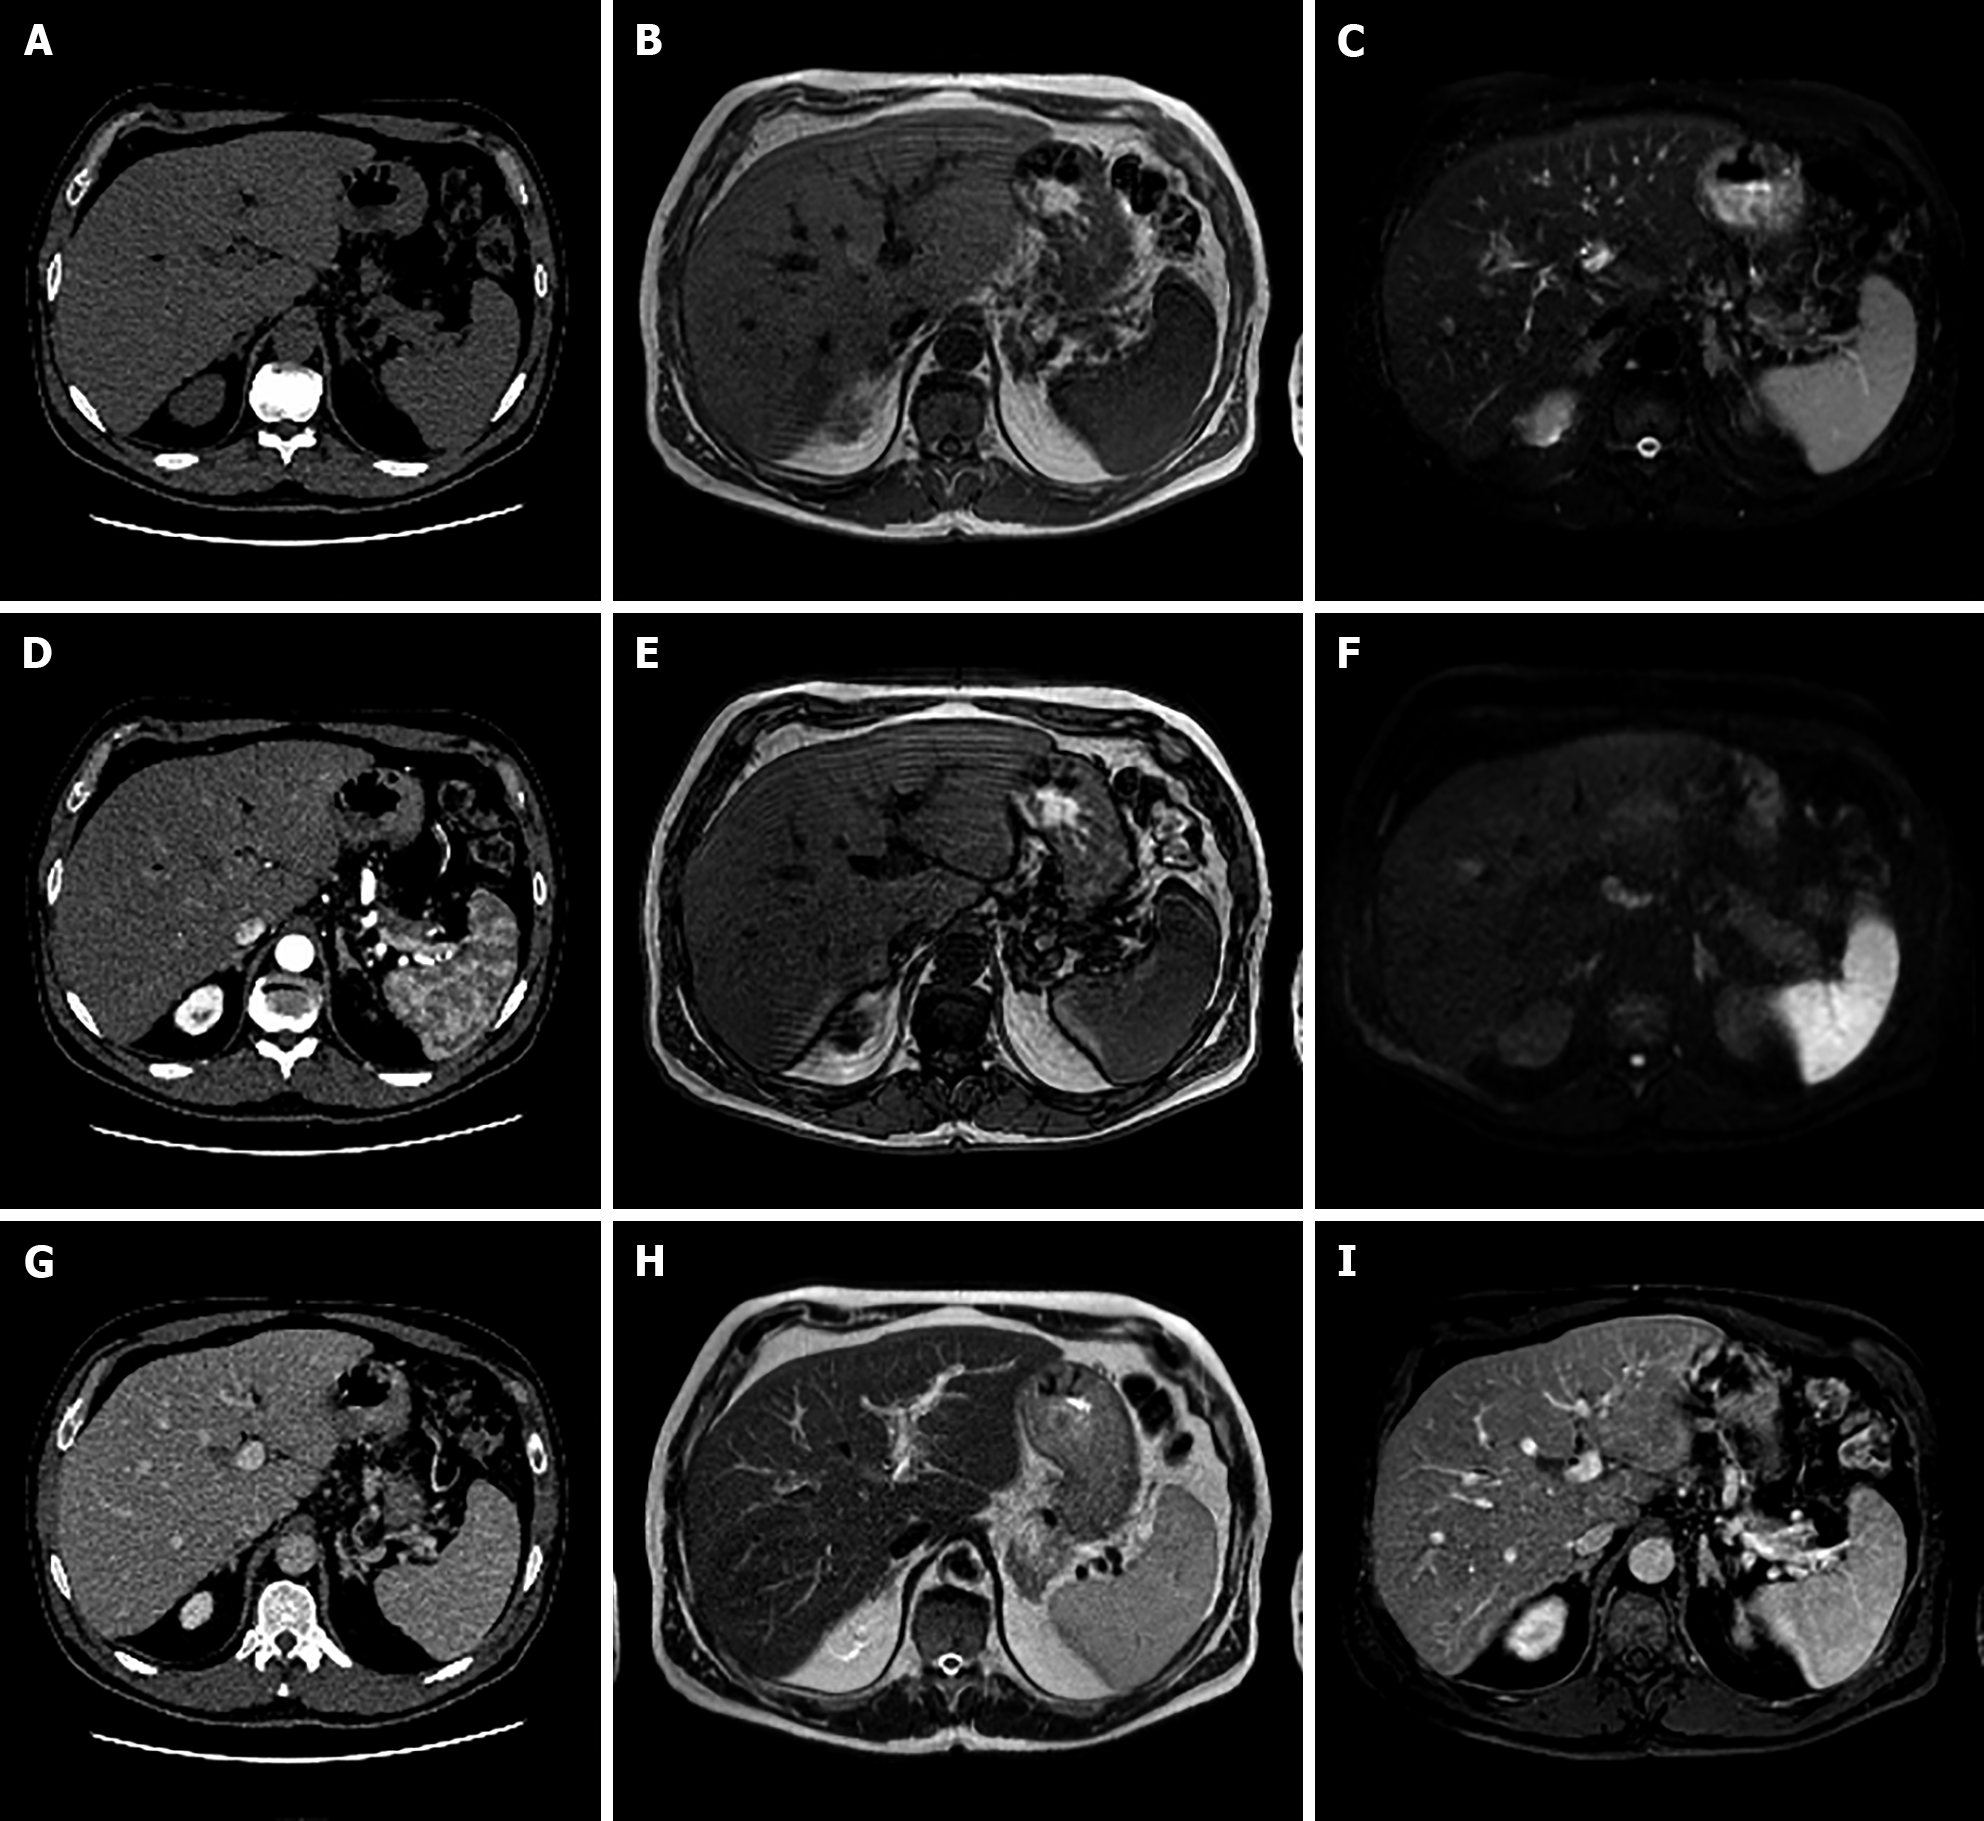
Figure 12 A 50-year-old male, unremarkable past medical history.
Multiphase abdominal computed tomography study shows a hypodense liver area near the porta hepatis. Subsequent magnetic resonance imaging liver study confirmed a hilar area slightly hyperintense on T1 in-phase sequence, with signal loss on opposed-phase images, slightly hyperintense on T2-turbo spin echo images, hypointense on T2-Spectral Attenuated Inversion Recovery images, without significant increased signal on diffusion weighted images and with no contrast enhancement on dynamic study. These features are consistent with an area of focal fatty infiltration. A: Unenhanced liver computed tomography (CT); B: In-phase T1-weighted image; C: T2-Spectral Attenuated Inversion Recovery; D: Arterial phase of liver CT; E: Out-of-phase T1-weighted image; F: High b-value diffusion weighted imaging; G: Portal venous phase of liver CT; H: T2-weighted image; I: Portal venous phase magnetic resonance imaging.
- Citation: Gatti M, Maino C, Tore D, Carisio A, Darvizeh F, Tricarico E, Inchingolo R, Ippolito D, Faletti R. Benign focal liver lesions: The role of magnetic resonance imaging. World J Hepatol 2022; 14(5): 923-943
- URL: https://www.wjgnet.com/1948-5182/full/v14/i5/923.htm
- DOI: https://dx.doi.org/10.4254/wjh.v14.i5.923


