Copyright
©The Author(s) 2022.
World J Hepatol. Apr 27, 2022; 14(4): 778-790
Published online Apr 27, 2022. doi: 10.4254/wjh.v14.i4.778
Published online Apr 27, 2022. doi: 10.4254/wjh.v14.i4.778
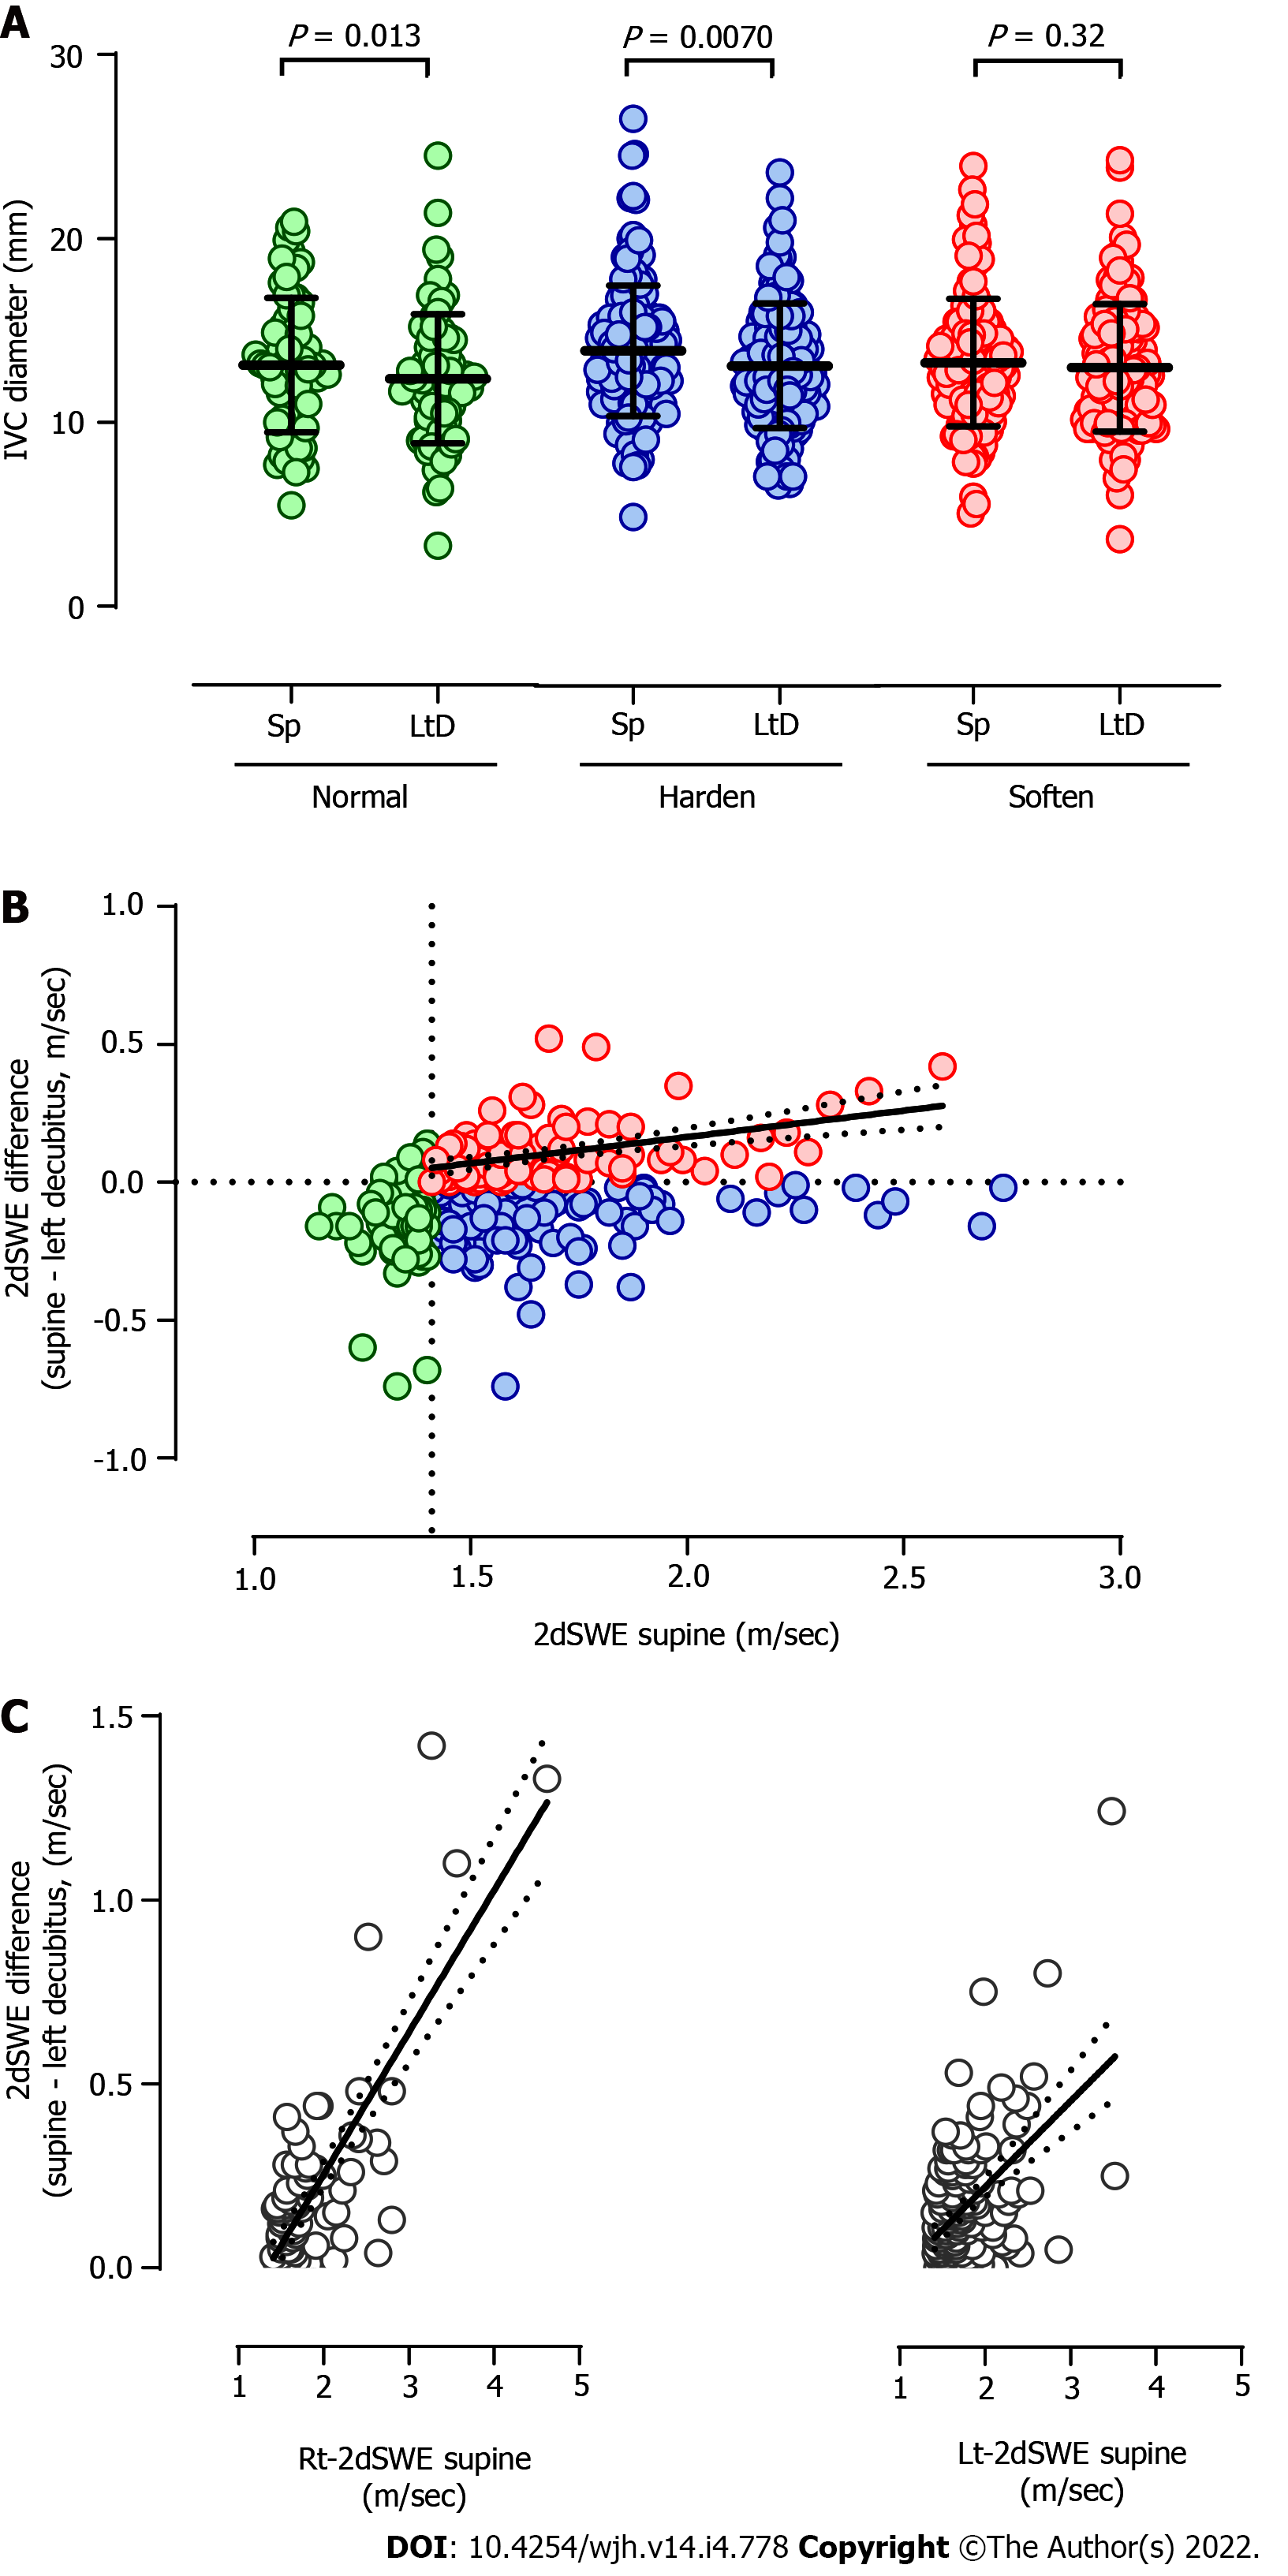
Figure 2 Alteration of the inferior vena cava diameter and liver stiffness after changing body positions.
A: The inferior vena cava diameter was significantly reduced in patients with normal two-dimensional shear wave elastography (2dSWE) values in the supine position (Normal, P = 0.013, 13.1 ± 3.7 vs 12.4 ± 3.5 mm) or patients with abnormal 2dSWE in the supine position that further hardened in the left decubitus position (Harden, P = 0.0070, 13.9 ± 3.6 vs 13.1 ± 3.4 mm). However, the diameter was not reduced in patients with abnormal 2dSWE in the supine position that softened in the left decubitus position (Soften, P = 0.32, 13.3 ± 3.5 vs 13.0 ± 3.5 mm). The horizontal bars in each plot indicate the average (“Bold”) and standard deviation. Supine and LtD indicate the supine and left decubitus positions, respectively; B: 2dSWE in the supine position revealed a significant positive correlation with the difference in 2dSWE between the two body positions only in the Soften group (red) (P < 0.0001, r = 0.38) but not in the Normal (green) and Harden (blue) groups; C: In the Soften group, 2dSWE values in the supine position were plotted against the difference in 2dSWE between the supine and left decubitus positions in the right or left lobe. A Spearman's correlation coefficient of 0.48 in the right lobe was higher than 0.31 in the left lobe. The black continuous and dotted lines reveal the best hit and 95% confidence band in the equation of least squares between 2dSWE values in the supine position and the difference in 2dSWE for two body positions in B and C. IVC: Inferior vena cava; Sp: Supine; 2dSWE: Two-dimensional shear wave elastography.
- Citation: Suda T, Sugimoto A, Kanefuji T, Abe A, Yokoo T, Hoshi T, Abe S, Morita S, Yagi K, Takahashi M, Terai S. Gravity assistance enables liver stiffness measurements to detect liver fibrosis under congestive circumstances. World J Hepatol 2022; 14(4): 778-790
- URL: https://www.wjgnet.com/1948-5182/full/v14/i4/778.htm
- DOI: https://dx.doi.org/10.4254/wjh.v14.i4.778


