Copyright
©The Author(s) 2022.
World J Hepatol. Apr 27, 2022; 14(4): 778-790
Published online Apr 27, 2022. doi: 10.4254/wjh.v14.i4.778
Published online Apr 27, 2022. doi: 10.4254/wjh.v14.i4.778
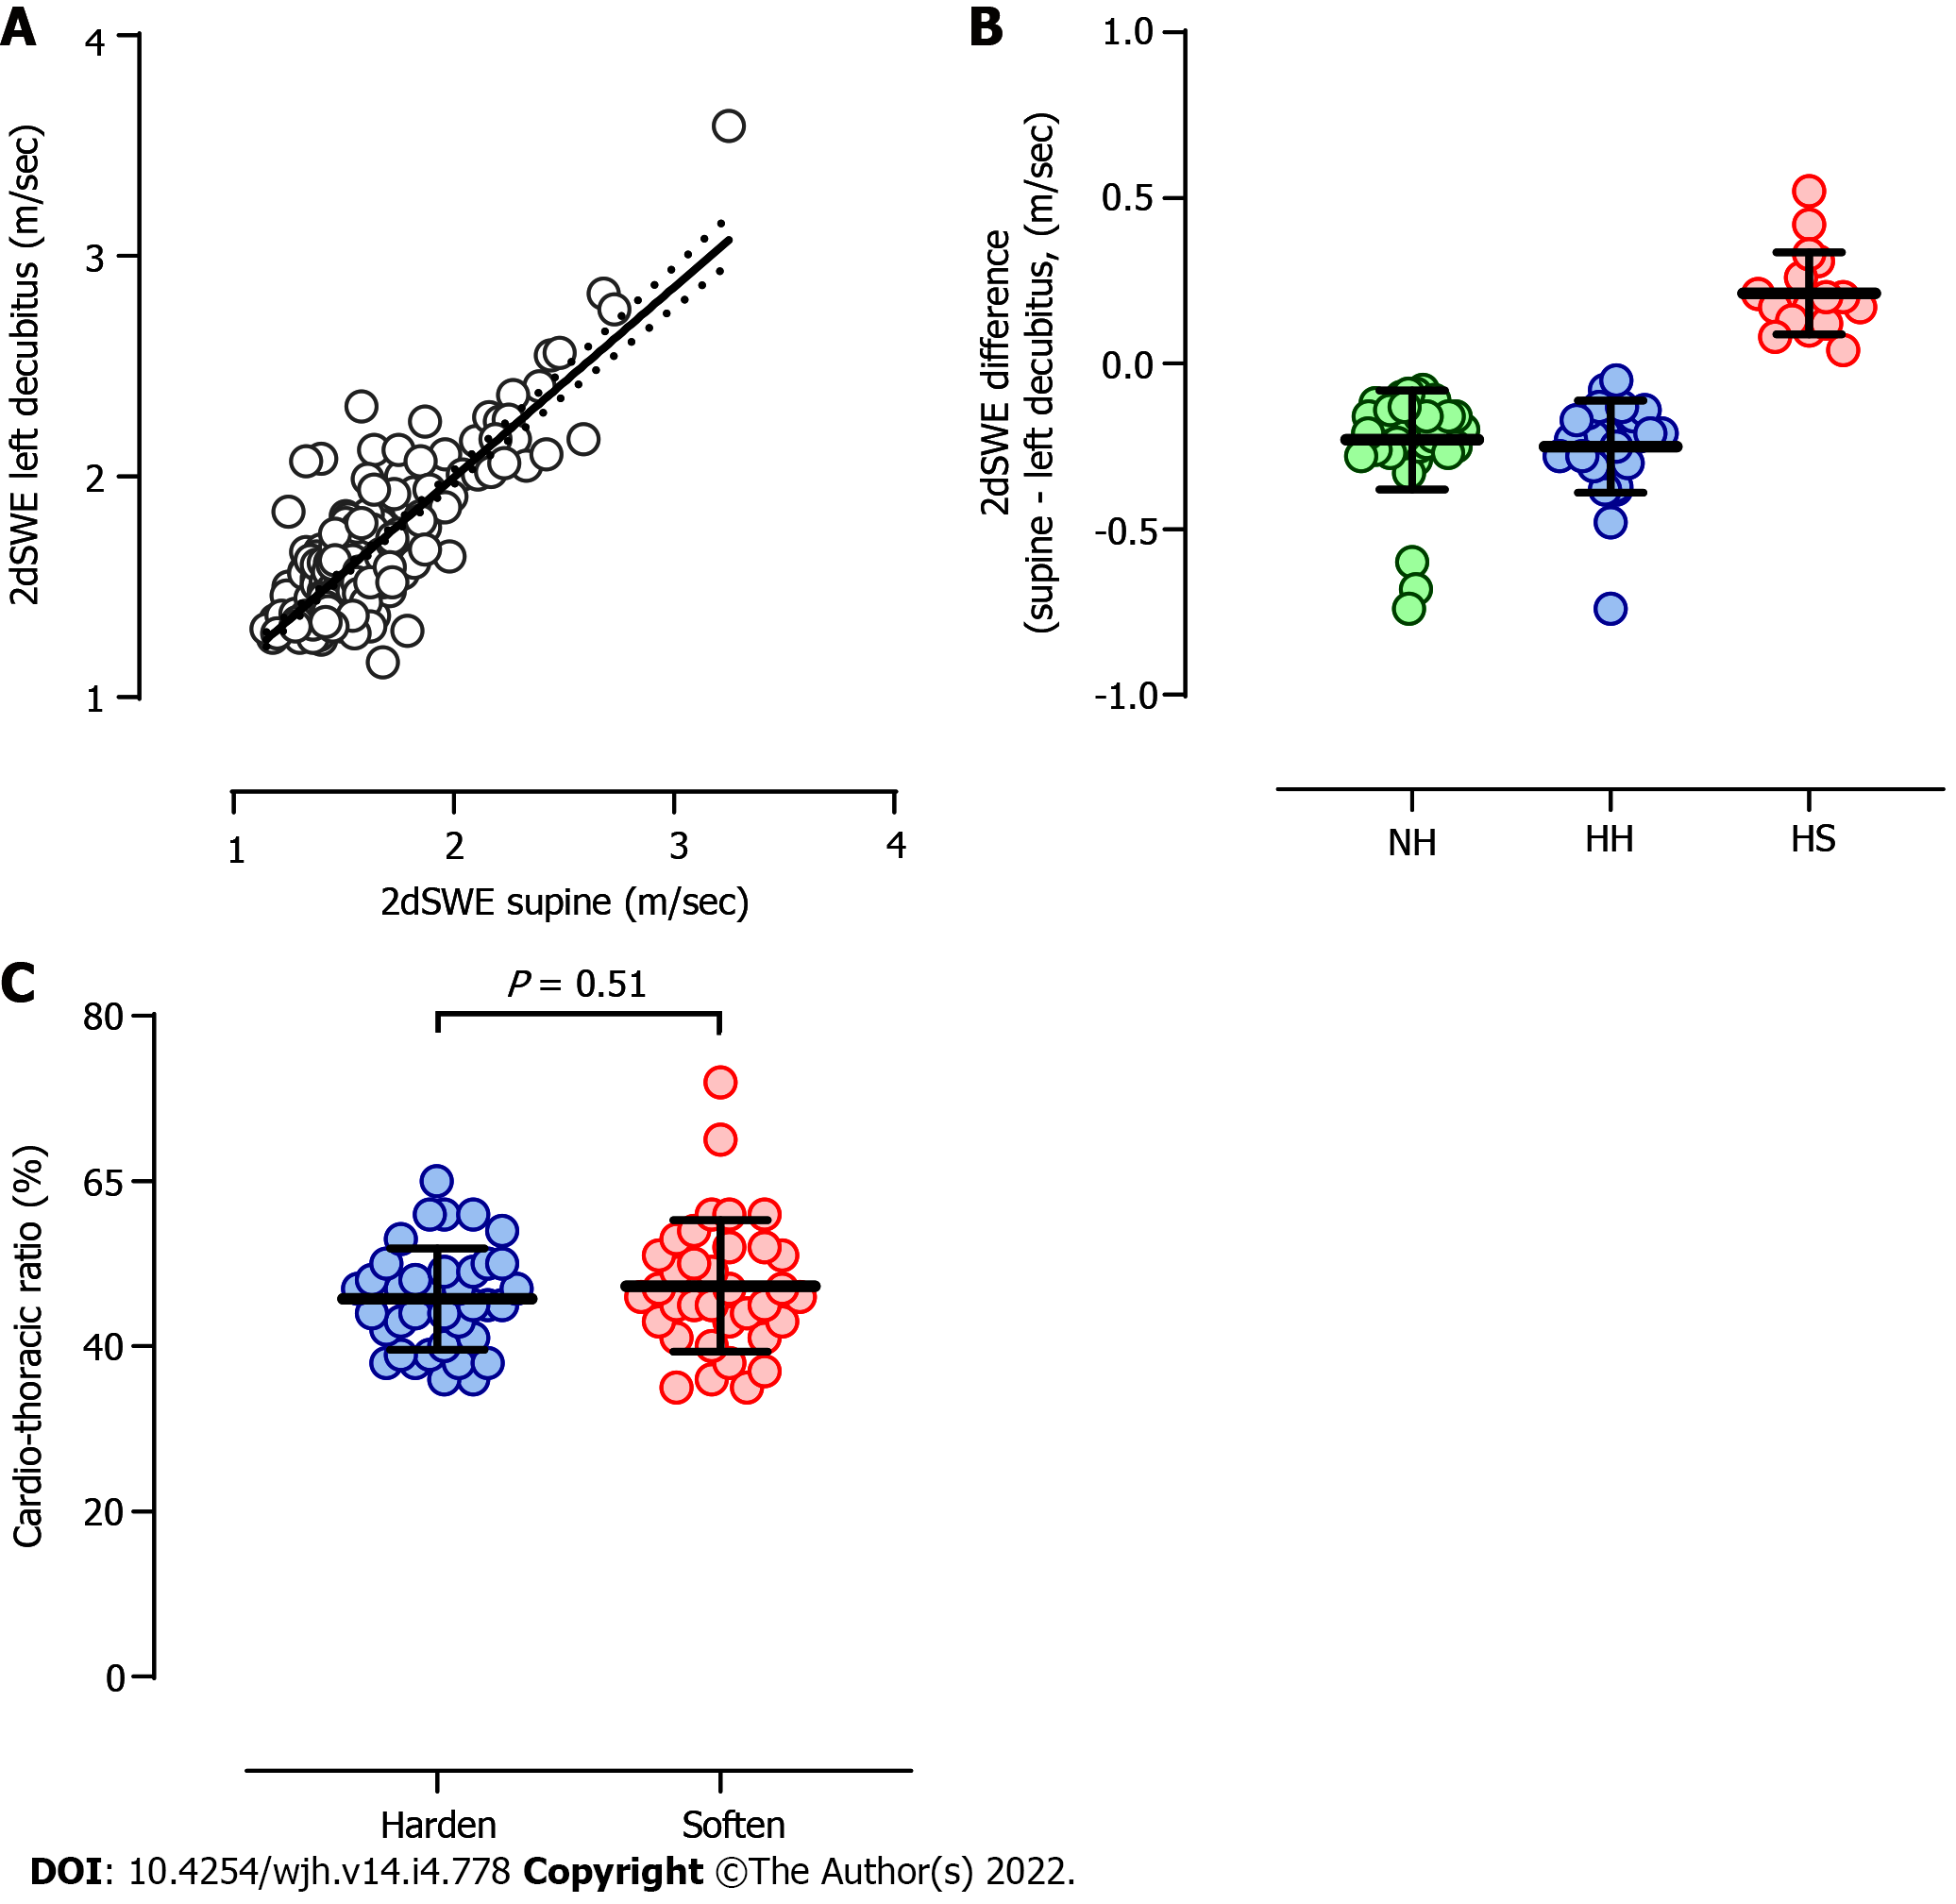
Figure 1 Body position effects on liver stiffness.
A: Two-dimensional shear wave elastography (2dSWE) values that were measured in the supine and left decubitus positions revealed a significant positive correlation (P < 0.0001, r = 0.68). The black continuous and dotted lines reveal the best hit and 95% confidence band in the equation of least squares; B: The cases in which 2dSWE increased or decreased in association with changing body positions beyond the magnitude of robust coefficient of variation can be classified into 3 groups: normal 2dSWE (Normal-to-Hard: NH) or abnormal 2dSWE that increased (Hard-to-Hard: HH) or decreased (Hard-to-Soft: HS) in the left decubitus position. The difference in 2dSWE between supine and left decubitus positions (supine - left decubitus) was negative in NH (-0.23 ± 0.15 m/sec) and HH (-0.25 ± 0.14 m/sec) but was positive in HS (0.21 ± 0.12 m/sec); C: The cardiothoracic ratio was not significantly different between the patients with abnormal 2dSWE in the supine position that further hardened or softened in the left decubitus position (P = 0.51, 47.3 ± 8.0 vs 45.7 ± 6.1%). The horizontal bars in B and C indicate the average (“Bold”) and standard deviation. 2dSWE: Two-dimensional shear wave elastography; HH: Hard-to-Hard; NH: Normal-to-Hard; HS: Hard-to-Soft.
- Citation: Suda T, Sugimoto A, Kanefuji T, Abe A, Yokoo T, Hoshi T, Abe S, Morita S, Yagi K, Takahashi M, Terai S. Gravity assistance enables liver stiffness measurements to detect liver fibrosis under congestive circumstances. World J Hepatol 2022; 14(4): 778-790
- URL: https://www.wjgnet.com/1948-5182/full/v14/i4/778.htm
- DOI: https://dx.doi.org/10.4254/wjh.v14.i4.778


