Copyright
©The Author(s) 2021.
World J Hepatol. Jan 27, 2022; 14(1): 244-259
Published online Jan 27, 2022. doi: 10.4254/wjh.v14.i1.244
Published online Jan 27, 2022. doi: 10.4254/wjh.v14.i1.244
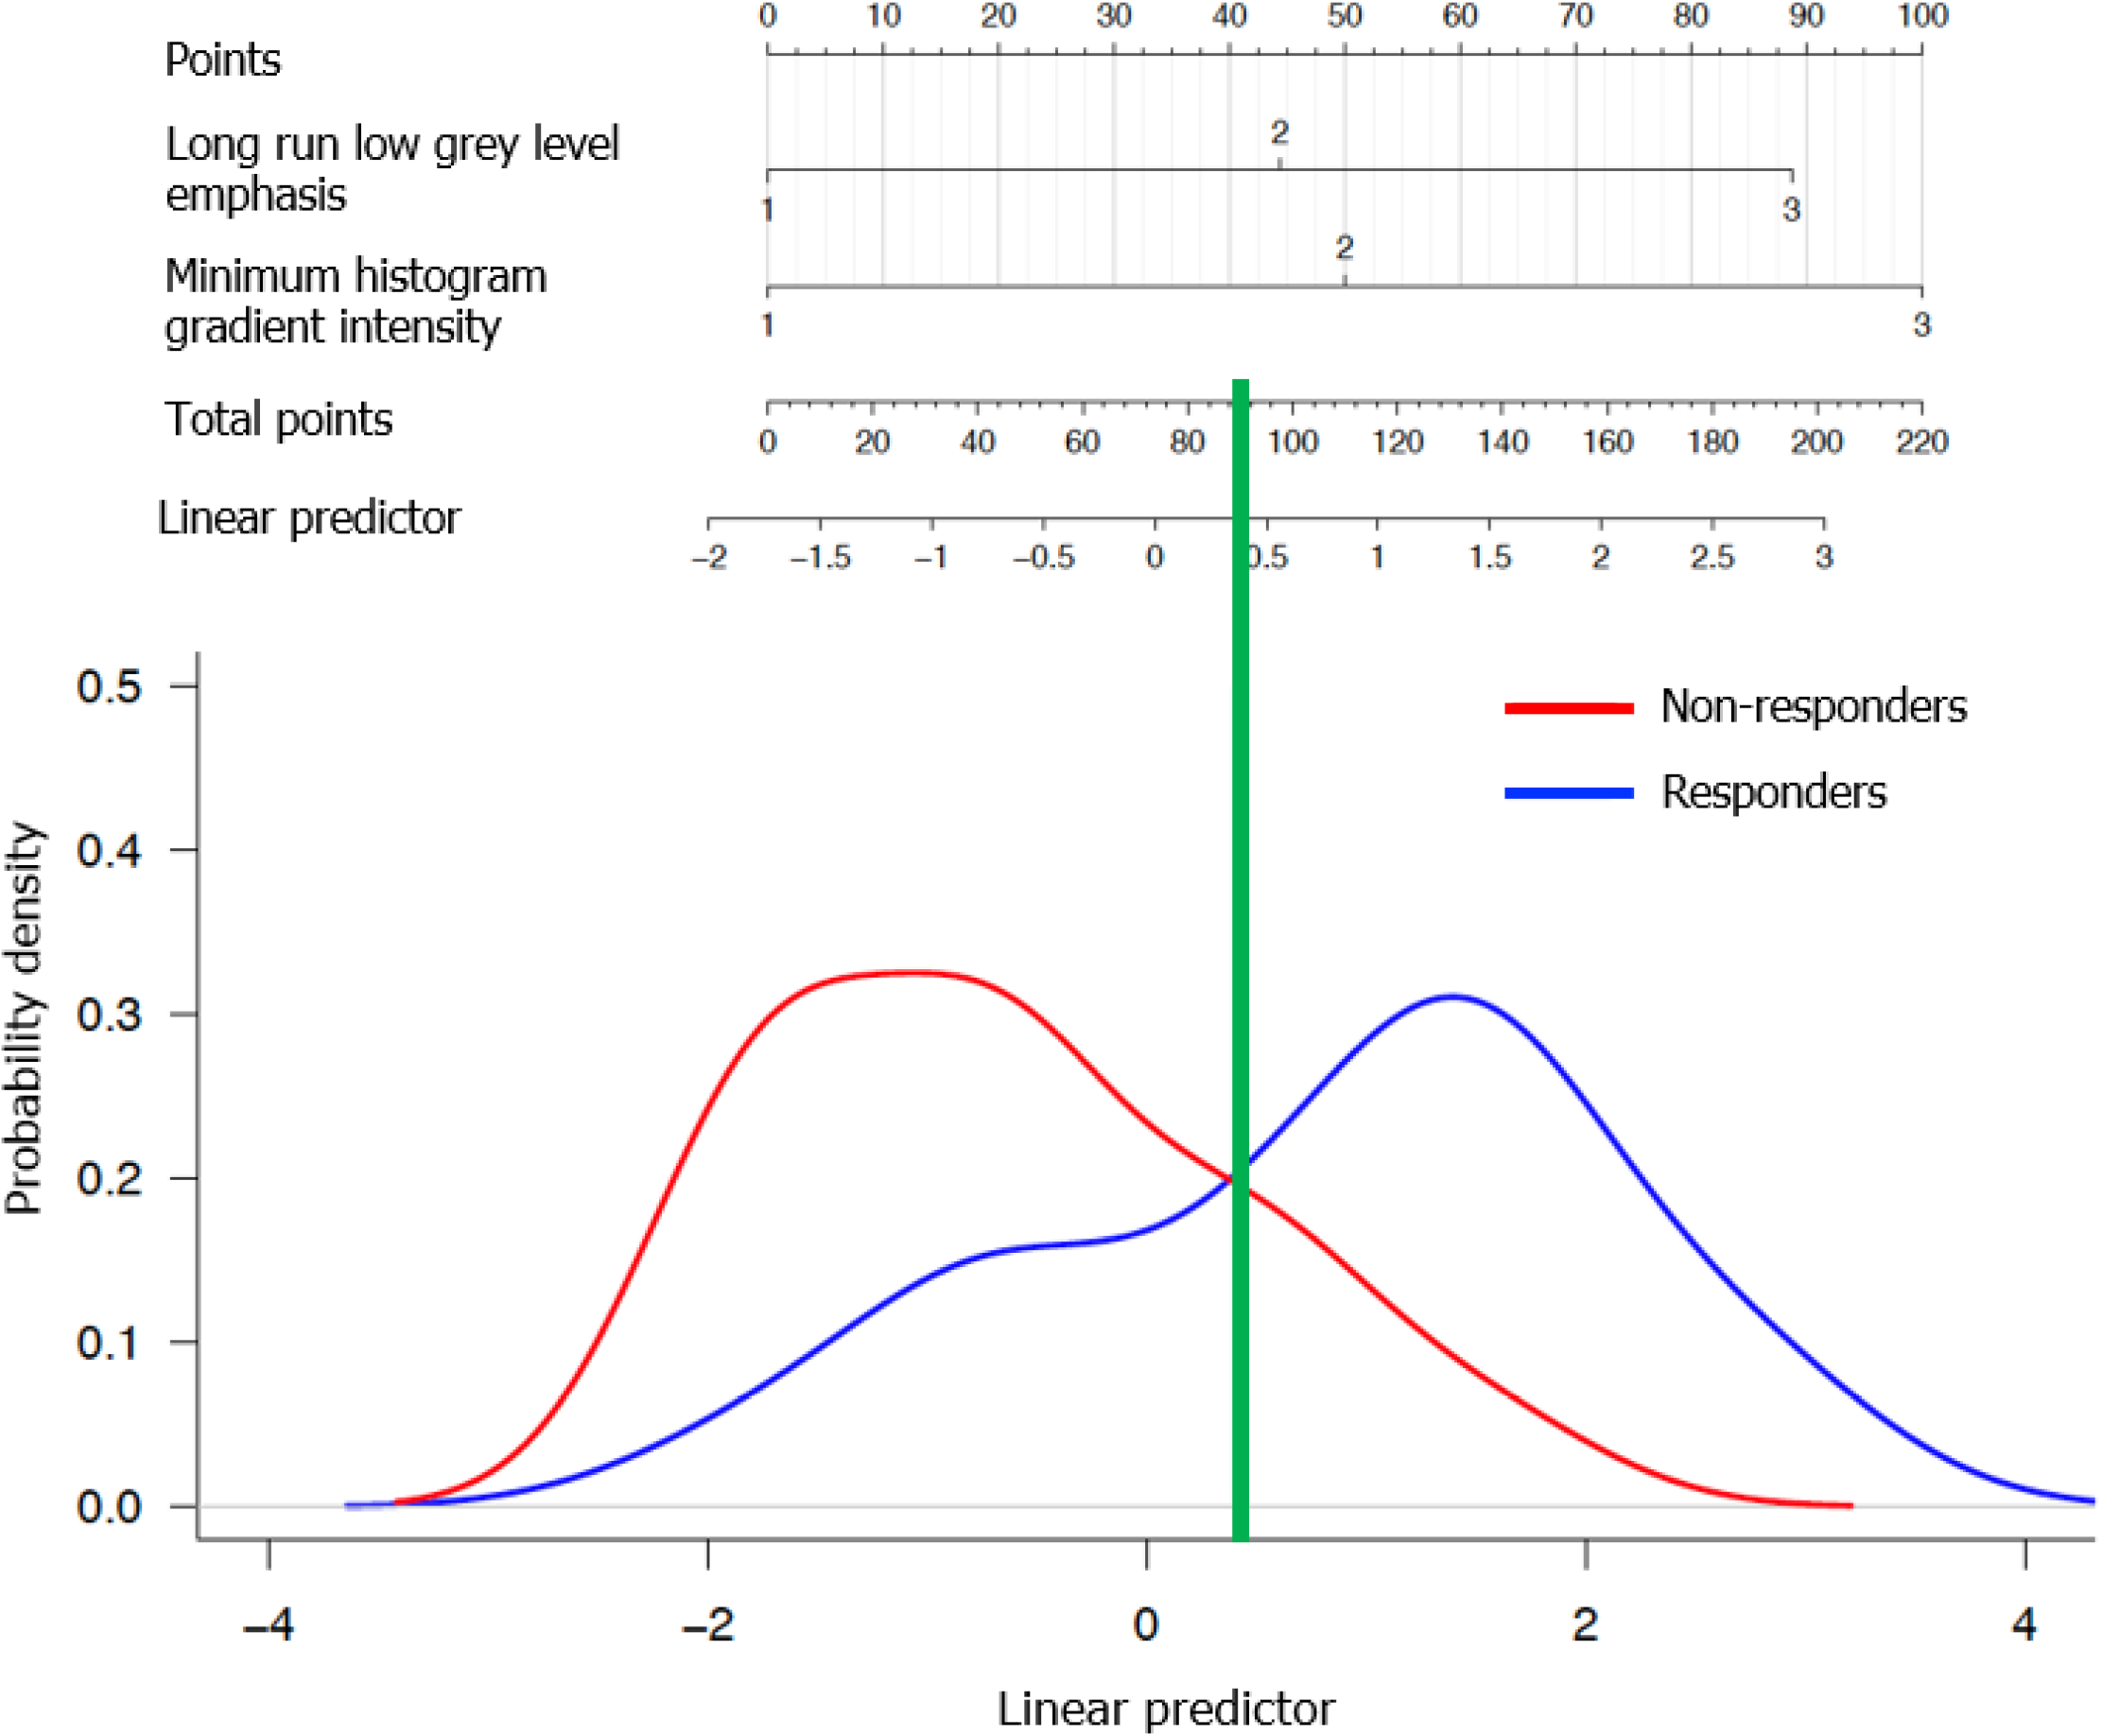
Figure 3 Prognostic nomogram of response to chemotherapy for patients.
Interpretation is as follows: for each predictor, determine the corresponding points by drawing a straight line up from the patient’s value; sum the points obtained for each predictor and locate the total sum on the upper point line. Identify the corresponding value in the linear predictor scale by drawing a straight line down. Values of linear predictor greater than the threshold (0.42) predict response; values less than the threshold predict no response.
- Citation: Rabe E, Cioni D, Baglietto L, Fornili M, Gabelloni M, Neri E. Can the computed tomography texture analysis of colorectal liver metastases predict the response to first-line cytotoxic chemotherapy? World J Hepatol 2022; 14(1): 244-259
- URL: https://www.wjgnet.com/1948-5182/full/v14/i1/244.htm
- DOI: https://dx.doi.org/10.4254/wjh.v14.i1.244


