Copyright
©The Author(s) 2021.
World J Hepatol. Sep 27, 2021; 13(9): 1079-1097
Published online Sep 27, 2021. doi: 10.4254/wjh.v13.i9.1079
Published online Sep 27, 2021. doi: 10.4254/wjh.v13.i9.1079
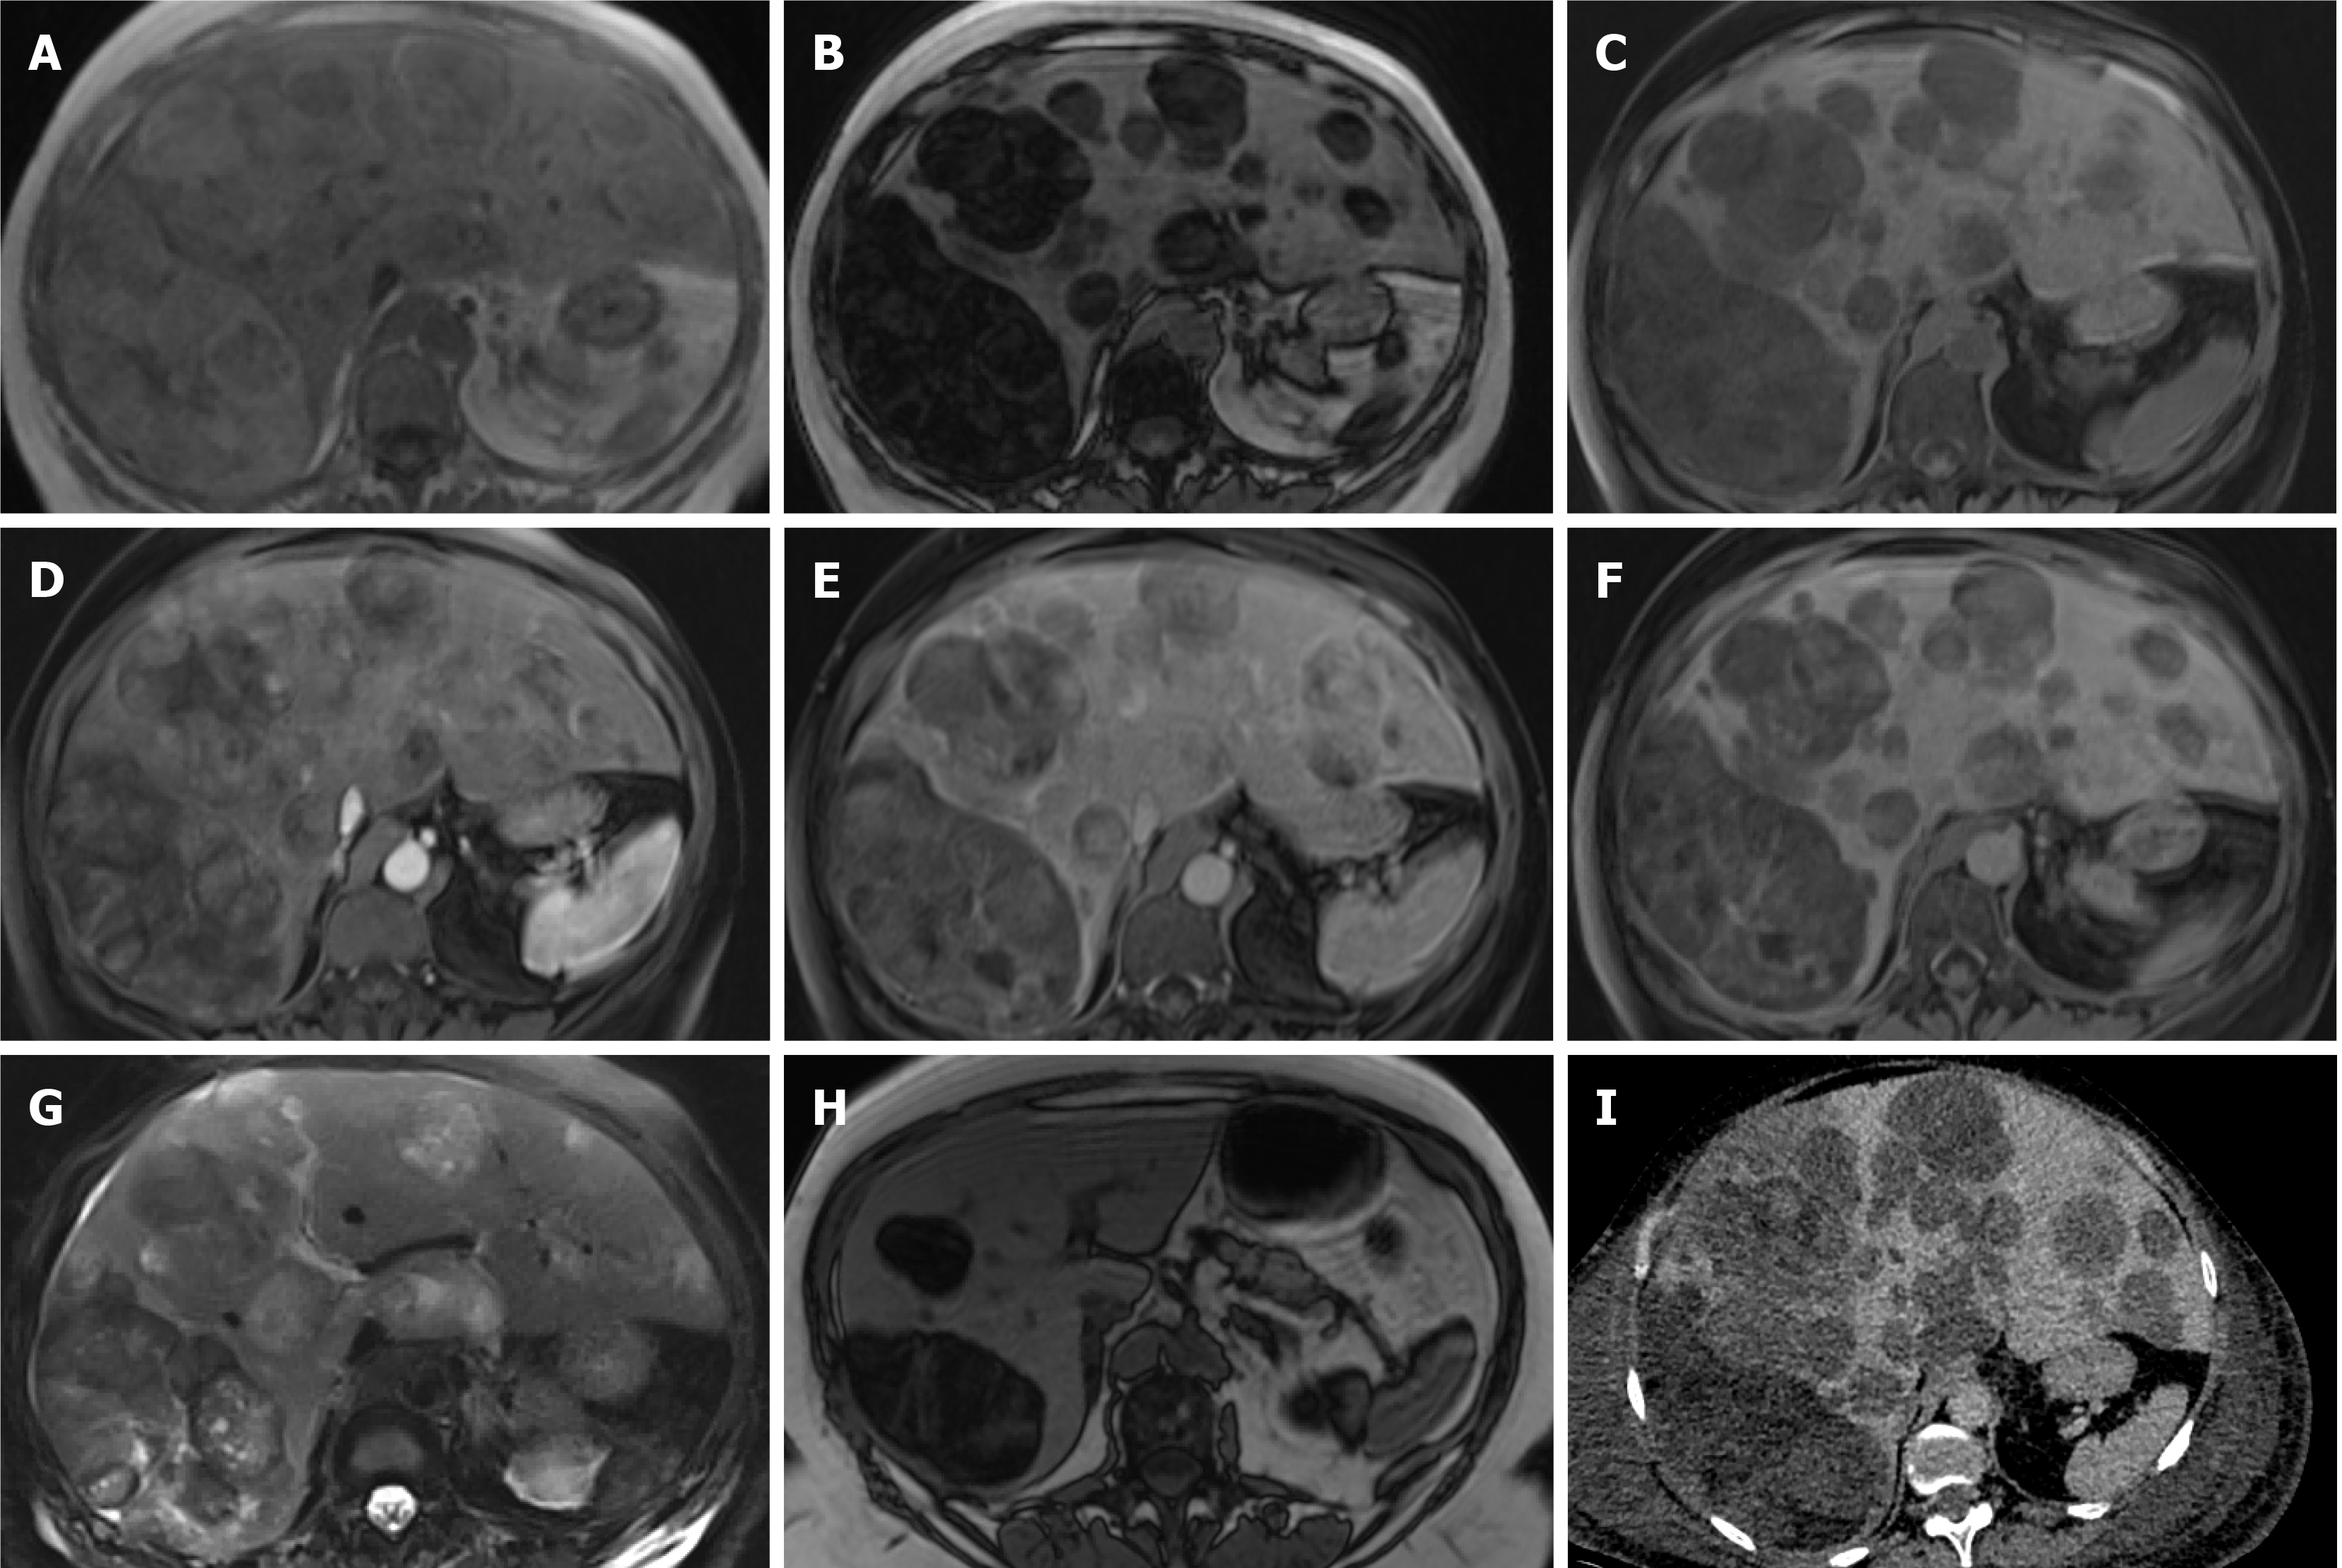
Figure 14 Pleomorphic liposarcoma.
A 54-year-old underwent routine ultrasound for re-assessment of gallbladder polyps seen a year ago. Ultrasound revealed multiple liver lesions not present previously and magnetic resonance (MR) of the liver was organised. This showed multiple fat containing liver lesions favoured to represent adenomas. The patient was not on any steroid medication at the time and had no other risk factors for hepatocellular adenoma. A-G: She represented 3 mo later with right sided chest pain and computed tomography (CT) pulmonary angiogram demonstrated increase in the size and number of liver lesions, at which point a second MR liver with gadoxetic acid was performed and is shown here; A-C: MR shows multiple bilobar liver lesions of low T1 signal (C) and predominantly fat component as demonstrated by signal loss on out-of-phase sequence (B) when compared to in-phase (A); D and E: Arterial (D) and delayed phase (E) sequences show a few heterogenous areas of hyperenhancement some of which washout; F: Majority of the lesions did not retain contrast on hepatobiliary phase with only the larger lesions showing some areas of uptake, predominantly within septations; G: T2-weighted sequence (G) shows the lesions are heterogenous and of varied signal intensity; H: Image H demonstrated out-of-phase sequence on the MR performed 3 mo prior for comparison of lesion burden increase in the interim; I: demonstrates portal venous phase CT performed 1 mo since the second MR, again showing quick interval increase in size and number of the lesions. Targeted liver biopsy was performed which confirmed pleomorphic liposarcoma.
- Citation: Noreikaite J, Albasha D, Chidambaram V, Arora A, Katti A. Indeterminate liver lesions on gadoxetic acid-enhanced magnetic resonance imaging of the liver: Case-based radiologic-pathologic review. World J Hepatol 2021; 13(9): 1079-1097
- URL: https://www.wjgnet.com/1948-5182/full/v13/i9/1079.htm
- DOI: https://dx.doi.org/10.4254/wjh.v13.i9.1079


