Copyright
©The Author(s) 2021.
World J Hepatol. Apr 27, 2021; 13(4): 456-471
Published online Apr 27, 2021. doi: 10.4254/wjh.v13.i4.456
Published online Apr 27, 2021. doi: 10.4254/wjh.v13.i4.456
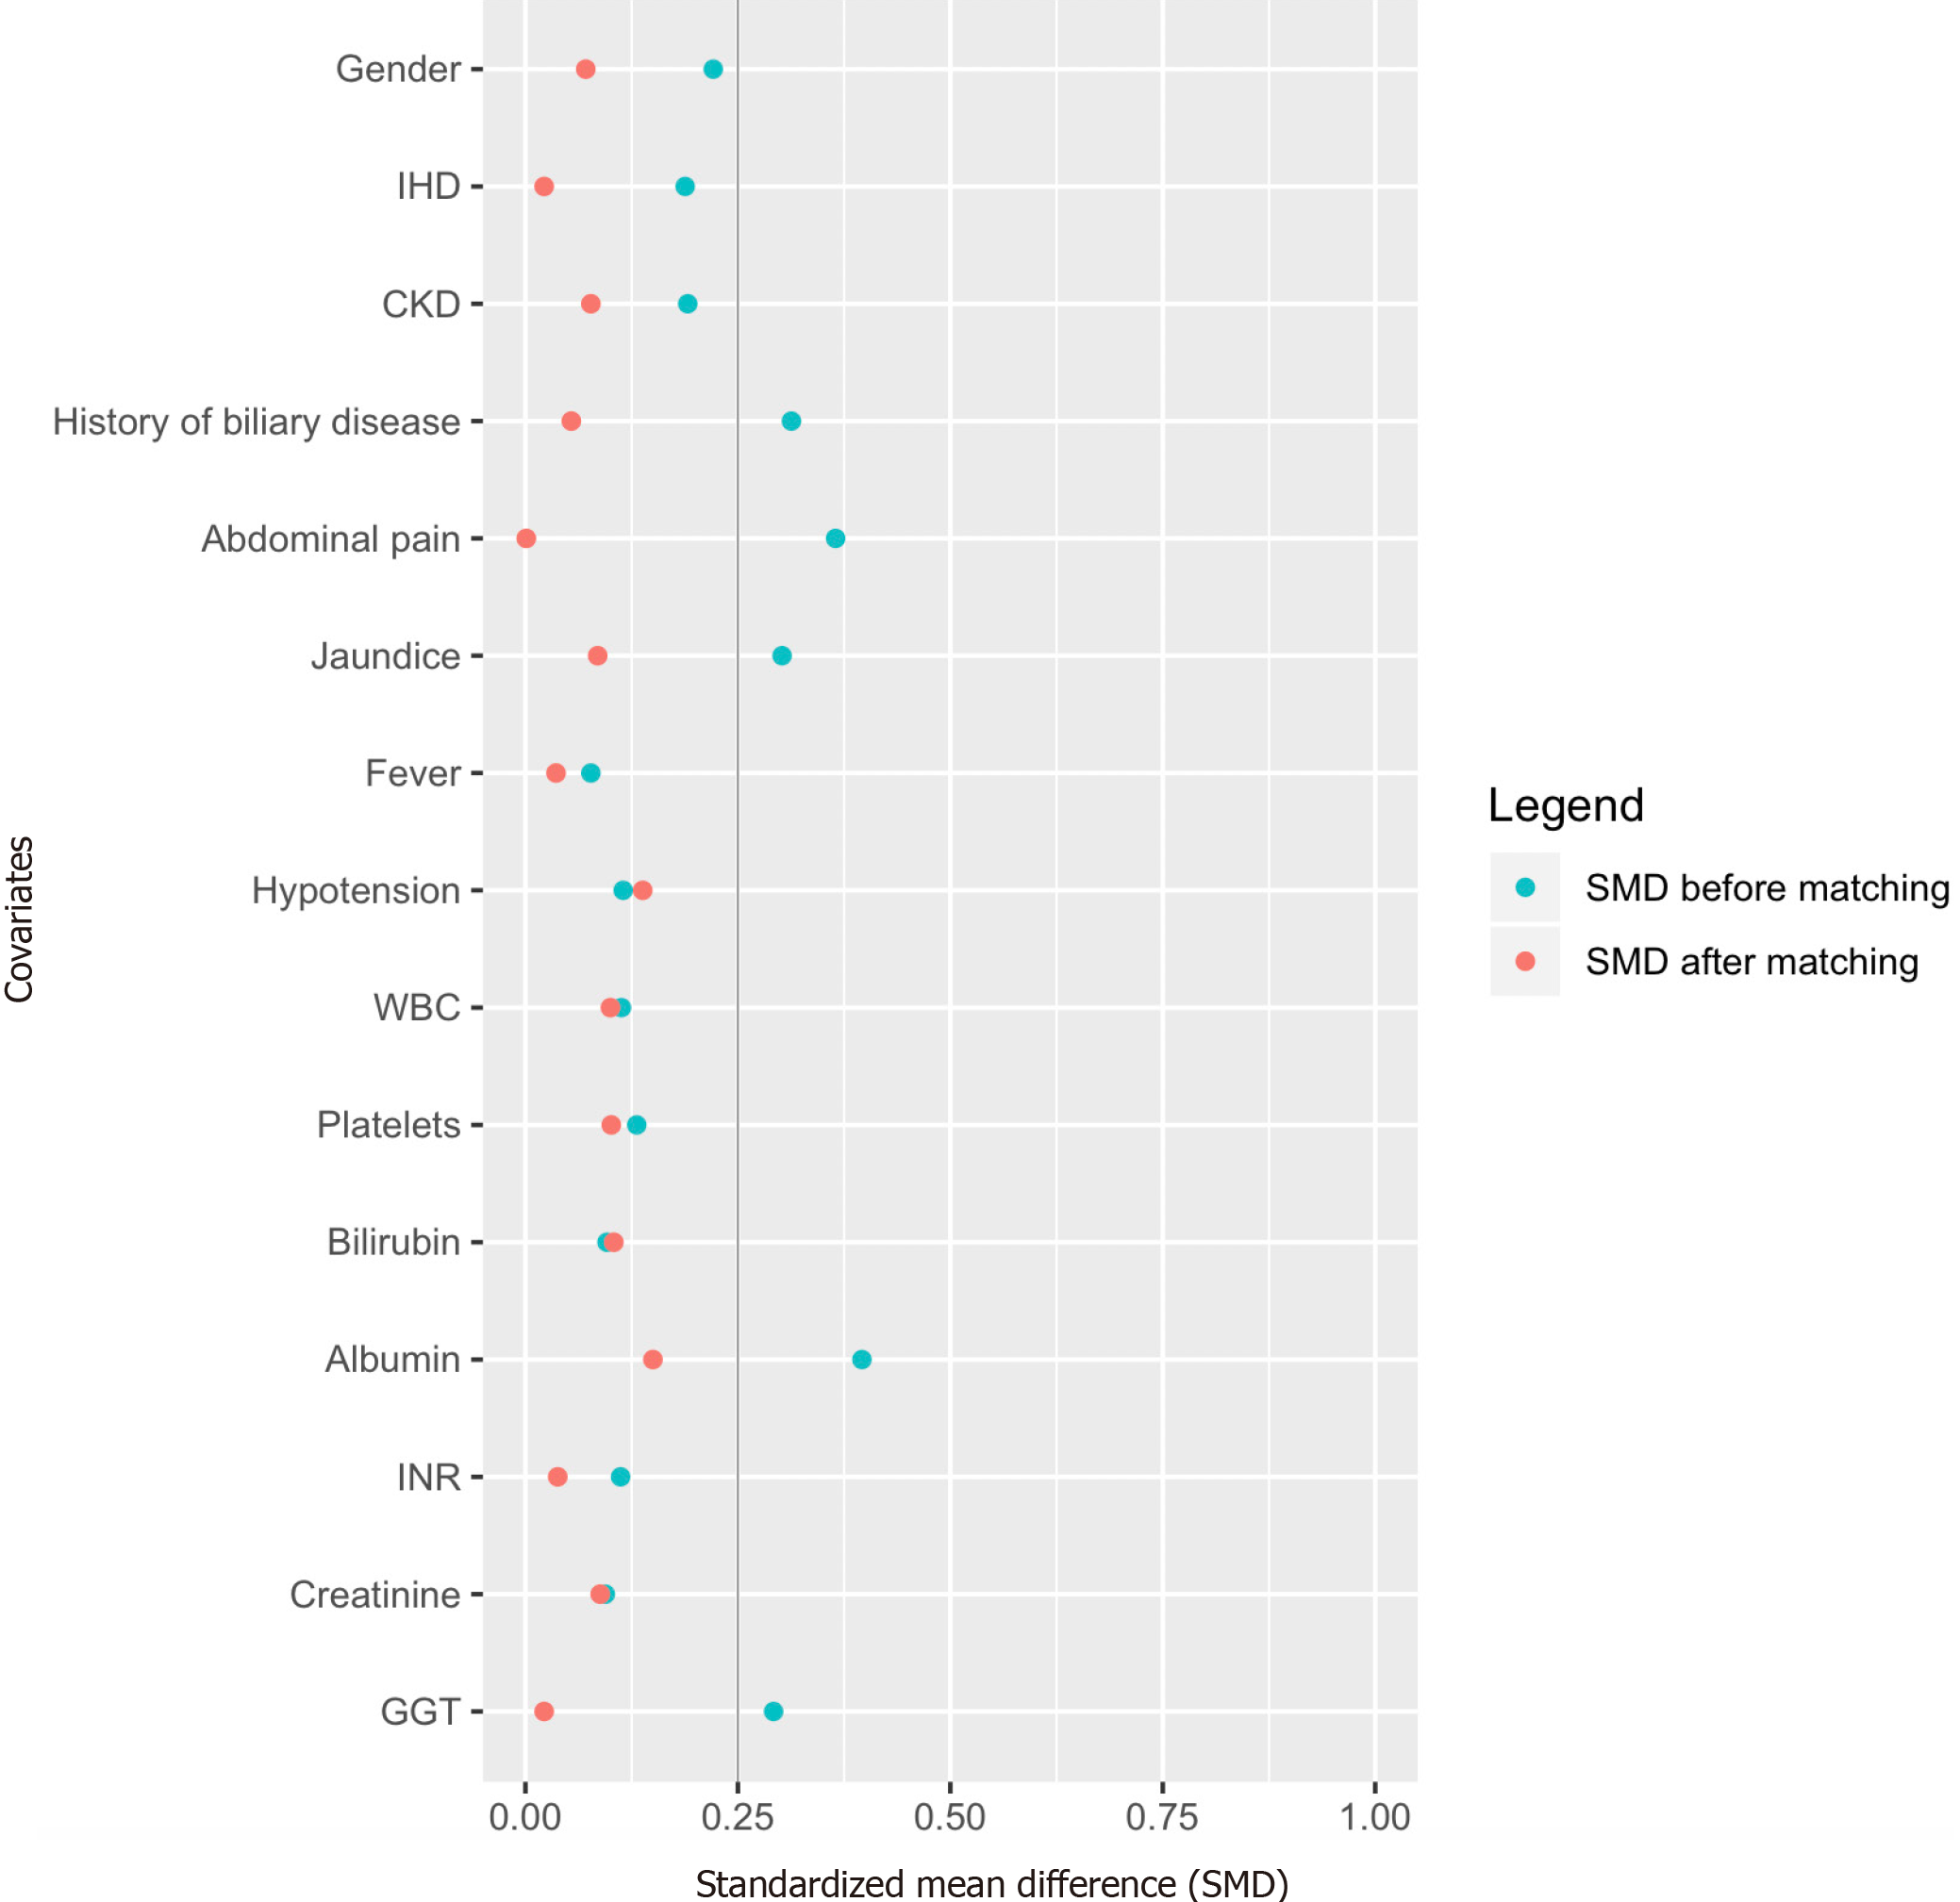
Figure 2 Plot of standardized mean difference in covariates: before propensity score matching (blue) and after propensity score matching (red).
Standardized mean difference of < 0.25 indicates adequate balance. IHD: Ischemic heart disease; CKD: Chronic kidney disease; WBC: White blood cell; INR: International normalized ratio; GGT: Gamma-glutamyl transferase.
- Citation: Chan KS, Mohan R, Low JK, Junnarkar SP, Huey CWT, Shelat VG. Elderly patients (≥ 80 years) with acute calculous cholangitis have similar outcomes as non-elderly patients (< 80 years): Propensity score-matched analysis. World J Hepatol 2021; 13(4): 456-471
- URL: https://www.wjgnet.com/1948-5182/full/v13/i4/456.htm
- DOI: https://dx.doi.org/10.4254/wjh.v13.i4.456


