Copyright
©The Author(s) 2021.
World J Hepatol. Mar 27, 2021; 13(3): 362-374
Published online Mar 27, 2021. doi: 10.4254/wjh.v13.i3.362
Published online Mar 27, 2021. doi: 10.4254/wjh.v13.i3.362
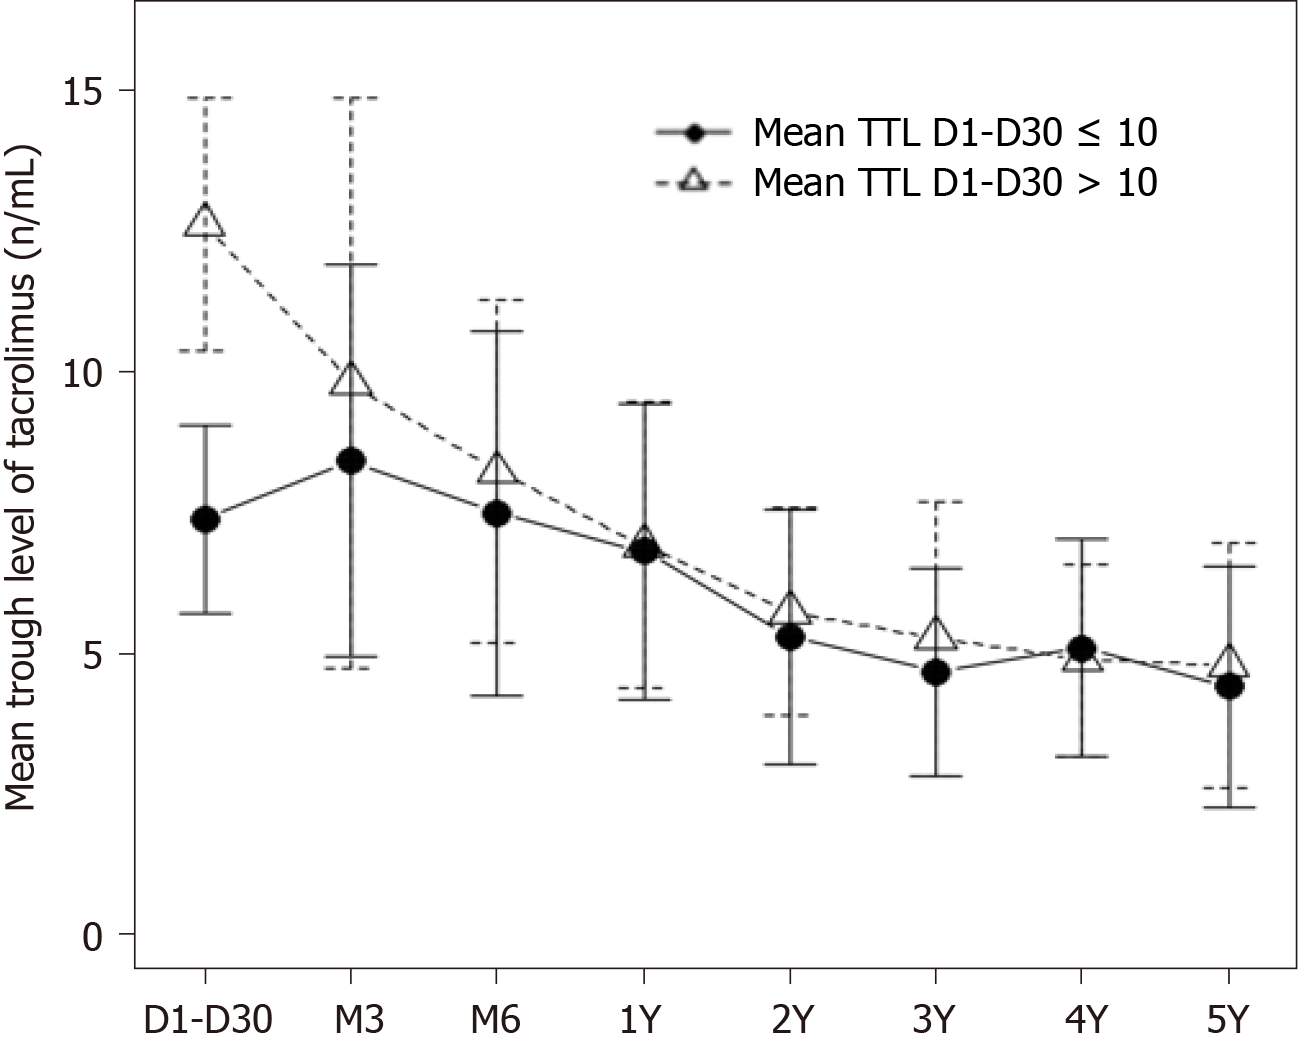
Figure 1 Mean serum tacrolimus levels according to the mean tacrolimus trough levels for each group within 1 mo after transplantation (mean ± SD).
P = 0.65 comparing means from month 3 (M3) to year 5 (5Y). TTL: Tacrolimus trough levels.
- Citation: Gastaca M, Ruiz P, Bustamante J, Martinez-Indart L, Ventoso A, Fernandez JR, Palomares I, Prieto M, Testillano M, Salvador P, Senosiain M, Suárez MJ, Valdivieso A. Early tacrolimus exposure does not impact long-term outcomes after liver transplantation. World J Hepatol 2021; 13(3): 362-374
- URL: https://www.wjgnet.com/1948-5182/full/v13/i3/362.htm
- DOI: https://dx.doi.org/10.4254/wjh.v13.i3.362


