Copyright
©The Author(s) 2021.
World J Hepatol. Feb 27, 2021; 13(2): 187-217
Published online Feb 27, 2021. doi: 10.4254/wjh.v13.i2.187
Published online Feb 27, 2021. doi: 10.4254/wjh.v13.i2.187
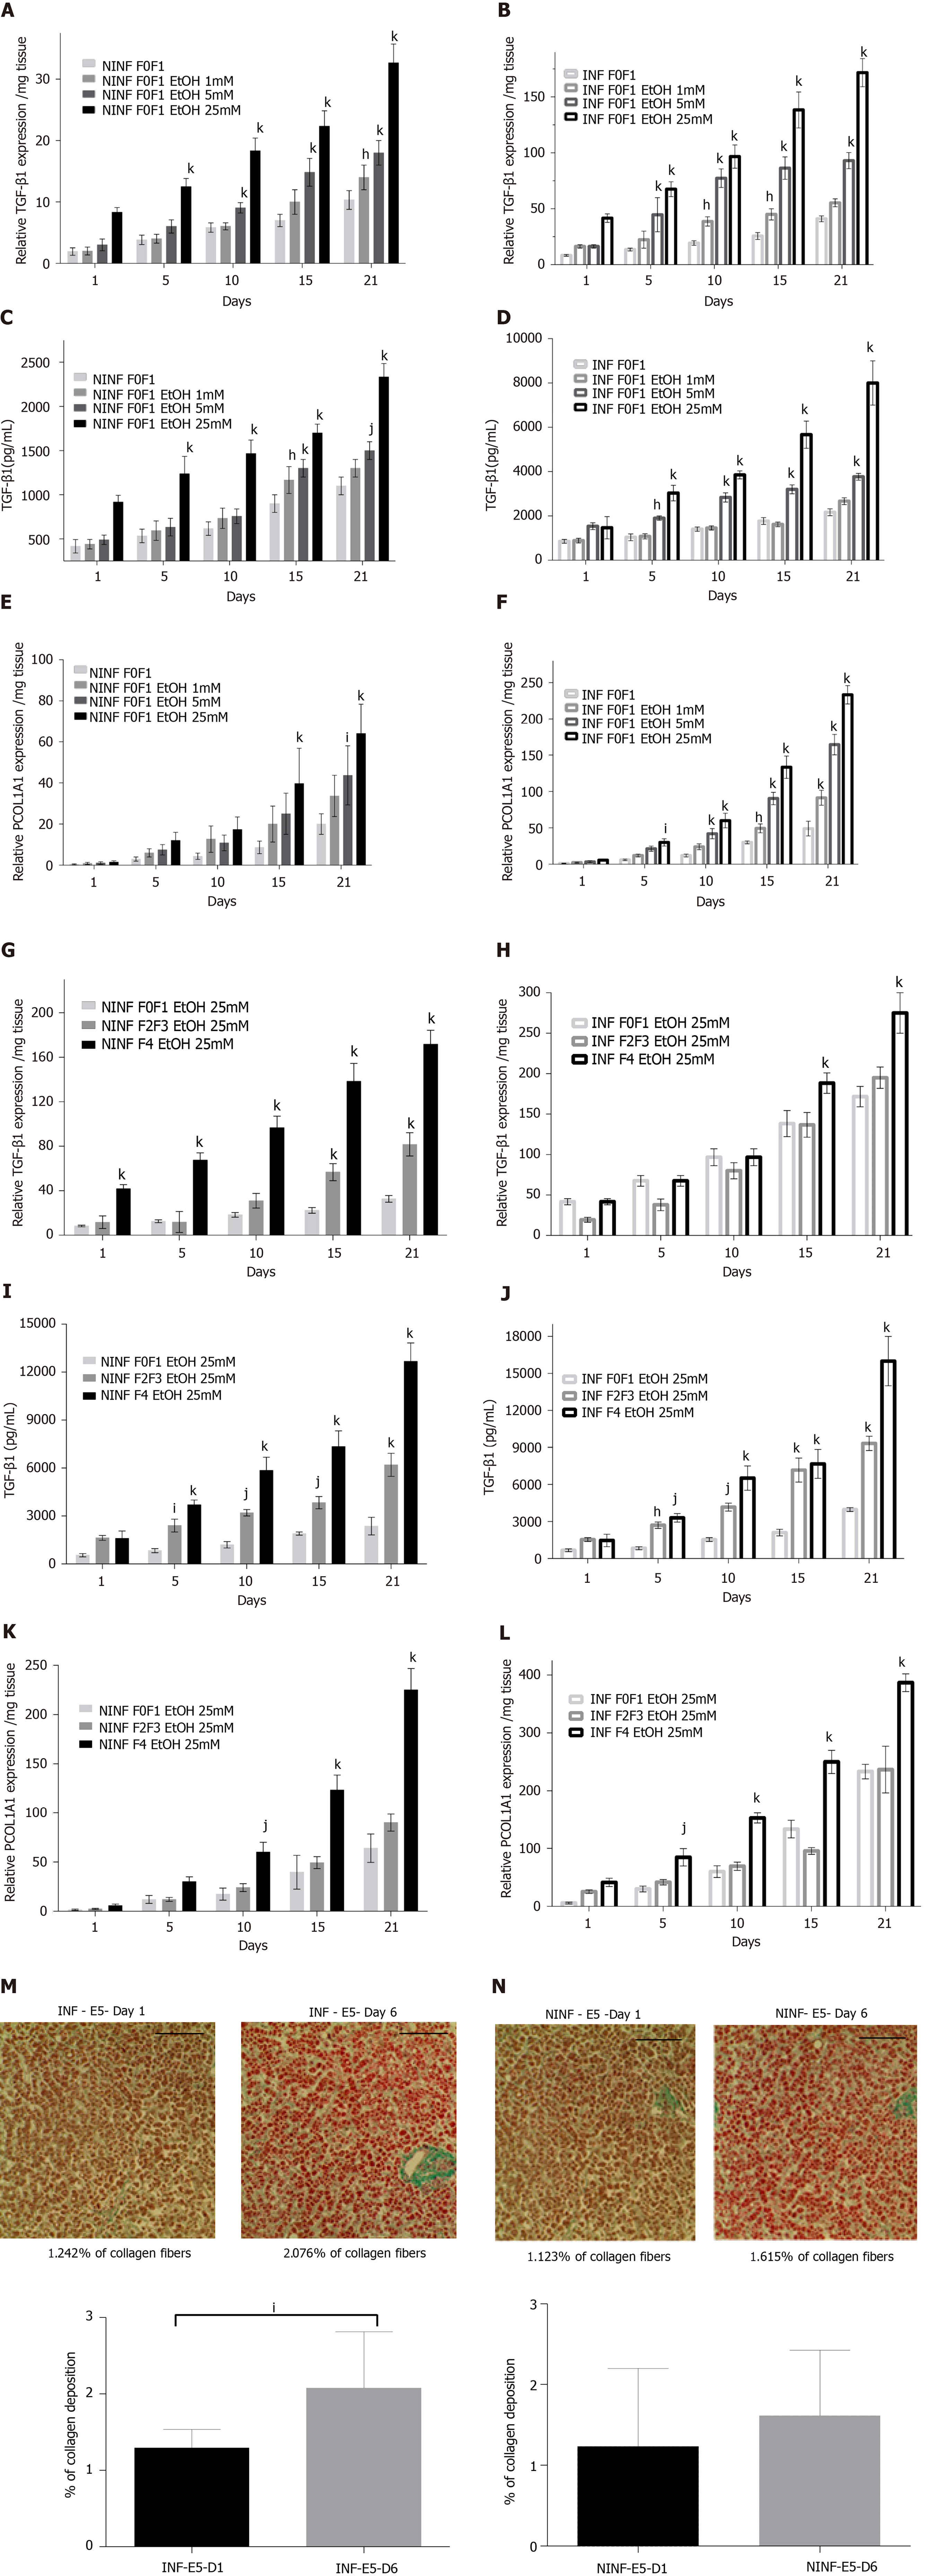
Figure 8 Significant increased expression of TGF-β1 and Procol1A1 mRNA with ethanol (1 mmol/L, 5 mmol/L, 25 mmol/L) treatment of non-infected or hepatitis C virus INF liver slice cultures from non-fibrotic (F0-F1) and ethanol (25 mmol/L) treatment of non-infected or hepatitis C virus infected liver slice cultures from fibrotic (F2-F3, F4) liver samples as shown by real-time reverse transcription-quantitative polymerase chain reaction and ELISA and histochemistry.
A and B: TGF-β1 mRNA expression (relative RNA expression / mg tissue) during 21 days follow up kinetics with ethanol (EtOH) (1 mmol/L, 5 mmol/L, 25 mmol/L) treatment in non-infected (NINF) or hepatitis C virus (HCV) INF liver slice (LS) cultures from non-fibrotic (F0-F1); C and D: Extracellular TGF-β1 protein expression (pg/mL) during 21 days follow up kinetics, with EtOH (1 mmol/L, 5 mmol/L, 25 mmol/L) treatment of NINF or HCV INF LS cultures from non-fibrotic (F0-F1); E and F: Procol1A1 mRNA expression (relative RNA expression/mg tissue) during 21 days follow up kinetic, with EtOH (1 mmol/L, 5 mmol/L, 25 mmol/L) treatment of NINF or HCV INF LS cultures from non-fibrotic (F0-F1); G and H: TGF-β1 mRNA expression (relative RNA expression/mg tissue) during 21 days follow up kinetics, in fibrotic (F2-F3, F4) NINF and HCV INF LS treated with 25 mmol/L of EtOH compared to F0F1 NINF or HCV INF LS cultures in presence of the 25 mmol/L EtOH; I and J: Extracellular TGF-β1 protein expression (pg/mL) during 21 days follow up kinetics, in fibrotic (F2-F3, F4) NINF and HCV INF LS after treatment with 25 mmol/L of EtOH compared to F0F1 NINF or HCV INF LS cultures in presence of 25 mmol/L EtOH; K and L: Relative Procol1A1 mRNA expression (relative RNA expression/mg tissue) during 21 days follow up kinetics, in fibrotic (F2-F3, F4) NINF and HCV INF LS treated with 25 mmol/L of EtOH compared to F0F1 NINF or HCV INF LS cultures in presence of 25 mmol/L EtOH. Data are expressed as means ± SEM (F0-F1, n = 5; F2-F3, n = 2; F4, n = 2). kP < 0.0001 subject vs control (non-treated); jP < 0.001 subject vs control (non-treated); iP < 0.01 subject vs control (non-treated), hP < 0.05 subject vs control (non-treated) (two-way ANOVA test); M: Significant increase of collagen deposition (% of collagen deposition) in F0-F1 HCV INF LS treated with 5 mmol/L of EtOH (E5) on day 6 (D6) compared to day 1 (D1); N: No significant change of collagen deposition (% of collagen deposition) in F0-F1 non-infected (NINF) LS treated with 5 mmol/L of EtOH (E5) on day 6 (D6) compared to day 1 (D1). Data are expressed as means ± SEM (n = 8). iP < 0.01 subject vs control (non-treated), (unpaired two-tailed Student’s t-test). Magnification 20X, Scale bars 100 µm.
- Citation: Kartasheva-Ebertz D, Gaston J, Lair-Mehiri L, Massault PP, Scatton O, Vaillant JC, Morozov VA, Pol S, Lagaye S. Adult human liver slice cultures: Modelling of liver fibrosis and evaluation of new anti-fibrotic drugs. World J Hepatol 2021; 13(2): 187-217
- URL: https://www.wjgnet.com/1948-5182/full/v13/i2/187.htm
- DOI: https://dx.doi.org/10.4254/wjh.v13.i2.187


