Copyright
©The Author(s) 2021.
World J Hepatol. Feb 27, 2021; 13(2): 187-217
Published online Feb 27, 2021. doi: 10.4254/wjh.v13.i2.187
Published online Feb 27, 2021. doi: 10.4254/wjh.v13.i2.187
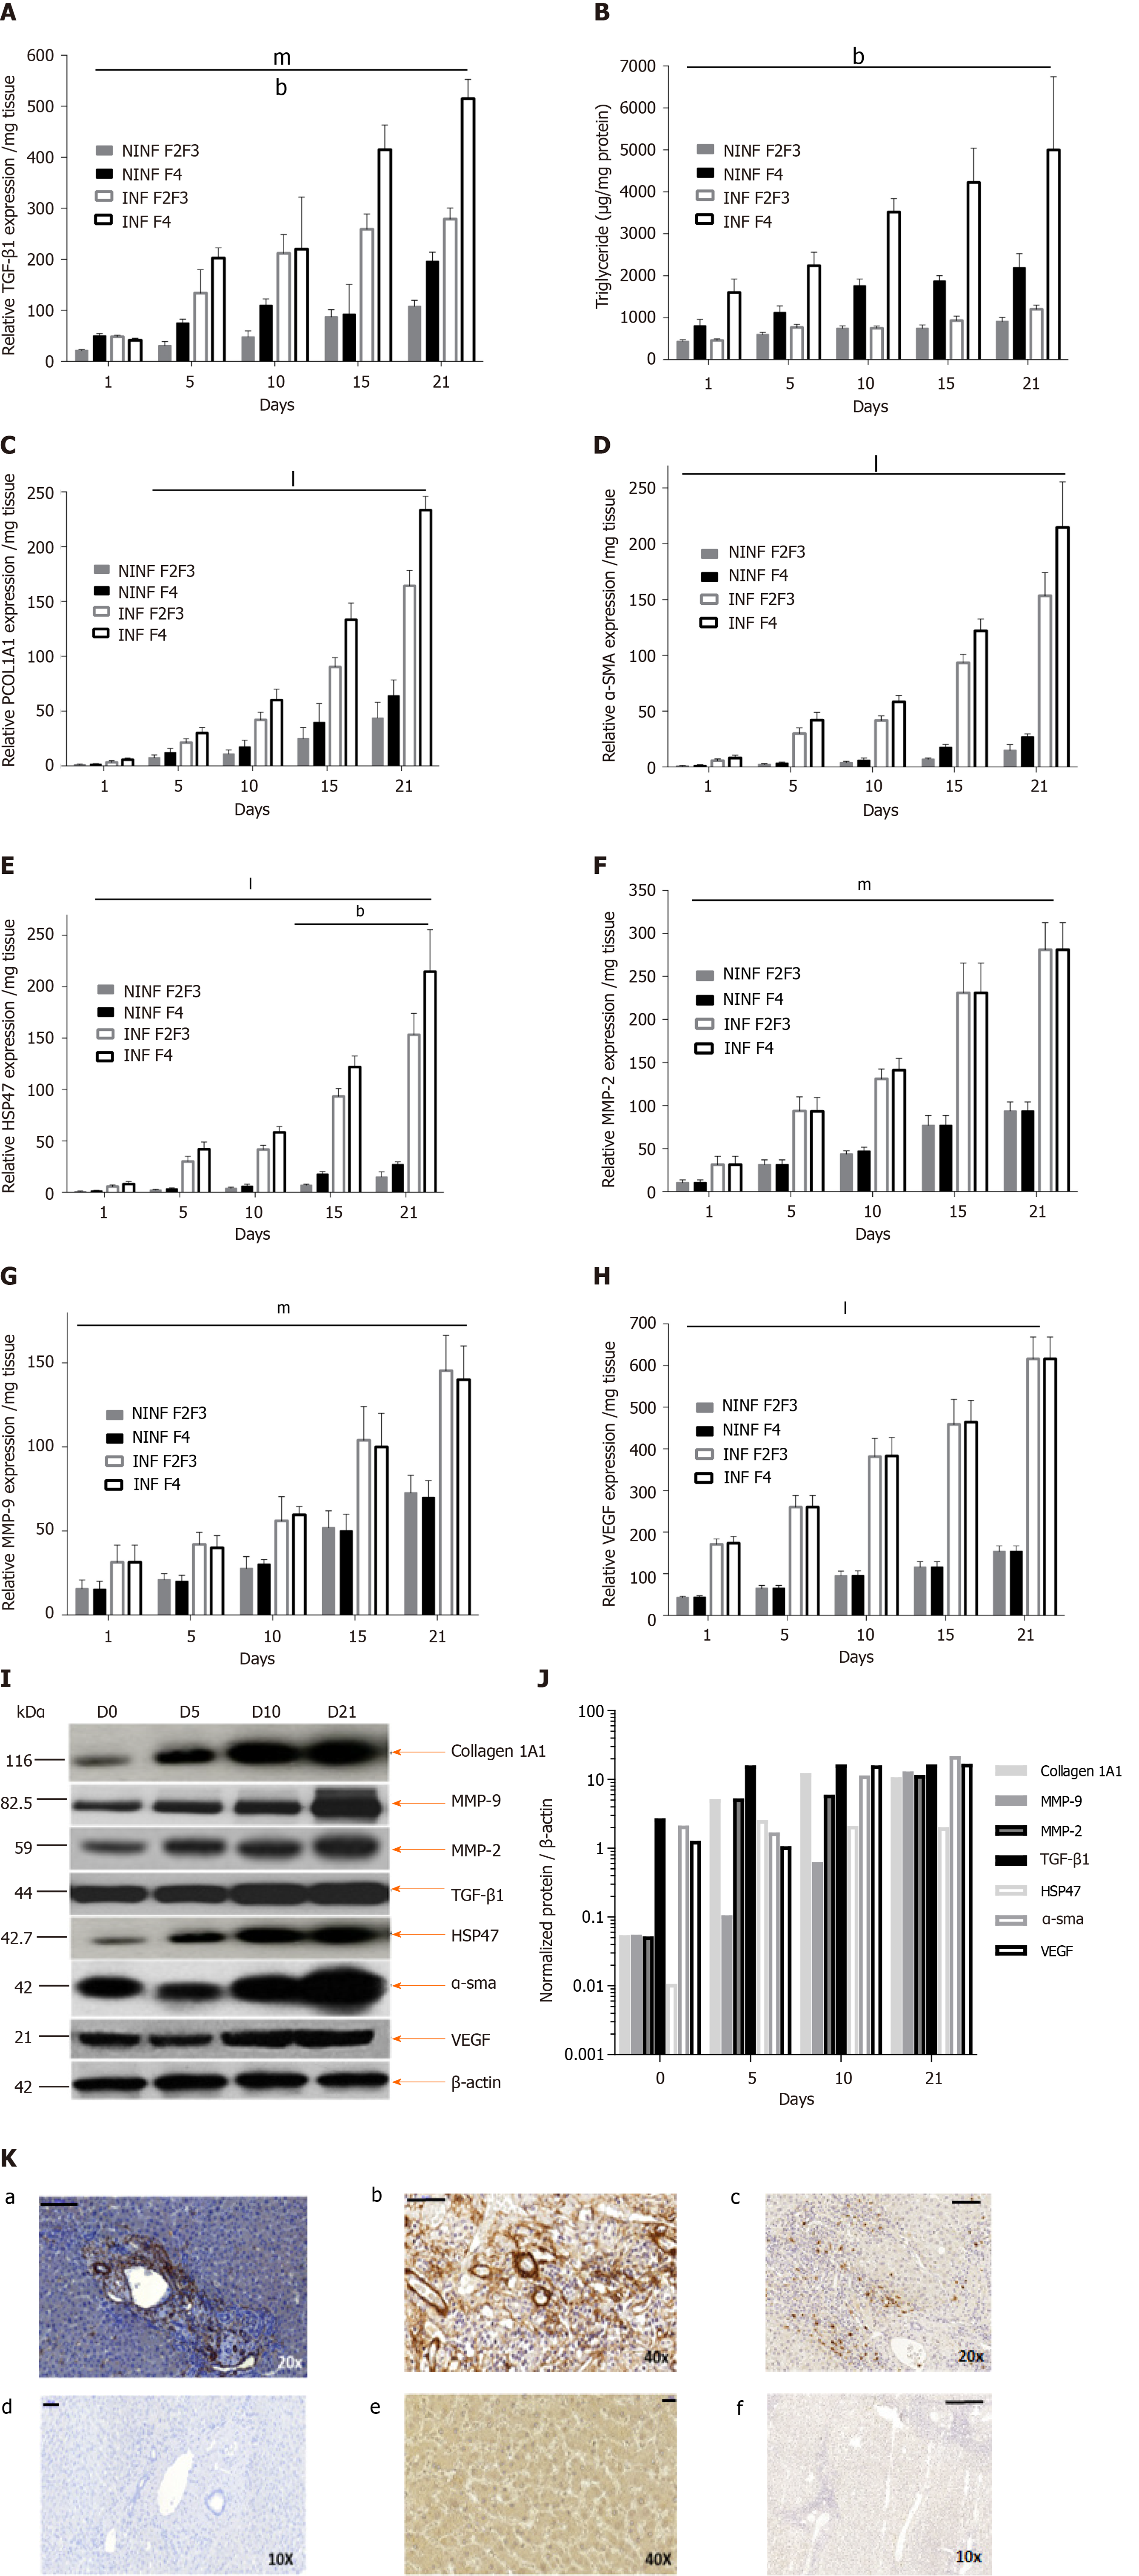
Figure 7 Real-time reverse transcription-quantitative polymerase chain reaction analyses of RNA expression of liver fibrosis markers (TGF-β1, Procol1A1, α-SMA, HSP47, MMP-2, MMP-9, VEGF), and triglyceride production in non-infected or hepatitis C virus infected liver slice cultures from fibrotic liver (F2-F3, F4) showing a significant increase during the kinetics.
A: TGF-β1 mRNA Expression (relative RNA expression/mg tissue) during 21 days follow up kinetics; B: Triglyceride production (µg/mg protein); C–E: Procol1A1, α-SMA, HSP47 mRNA expression (relative RNA expression / mg tissue) during 21 days follow up kinetics; F- H: MMP-2, MMP-9 and VEGF mRNA expression (relative RNA expression/mg tissue) during 21 days follow up kinetics. Data are expressed as mean± SD (F2-F3 liver samples, n = 2, F4 liver samples, n = 2). bP < 0.01 fibrosis stage factor; mP < 0.001 Infection factor; lP < 0.0001 infection factor; (two-way ANOVA test); I: TGF-β1, HSP-47, Collagen I alpha 1, MMP-9, MMP-2, a-SMA, VEGF proteins expression in F2-F3 liver slice performed in western blotting and normalized. Positions of molecular-weight markers are indicated in kDa; J: Normalization of the proteins expression compared to β-actin expression (Normalized protein/b-actin) during the 21 days follow-up kinetics using the image quantification standard software, ImageJ2; and K: Representative human liver tissue 7 µm-thick sections from F2-F3 liver patient showing immunohistochemistry staining for fibrosis markers, TGF-β1 (a), α-SMA (b), MMP-9 (c) on day 10, magnification 20×, Scale bars, 100 µm; 40×, Scale bars 50 µm; 10×, Scale bars 100 µm, respectively. (d-f) isotypes controls staining, magnification 10×, Scale bars, 100 µm; 40×, Scale bars 20 µm; 10×, Scale bars 200 µm, respectively.
- Citation: Kartasheva-Ebertz D, Gaston J, Lair-Mehiri L, Massault PP, Scatton O, Vaillant JC, Morozov VA, Pol S, Lagaye S. Adult human liver slice cultures: Modelling of liver fibrosis and evaluation of new anti-fibrotic drugs. World J Hepatol 2021; 13(2): 187-217
- URL: https://www.wjgnet.com/1948-5182/full/v13/i2/187.htm
- DOI: https://dx.doi.org/10.4254/wjh.v13.i2.187


