Copyright
©The Author(s) 2021.
World J Hepatol. Feb 27, 2021; 13(2): 187-217
Published online Feb 27, 2021. doi: 10.4254/wjh.v13.i2.187
Published online Feb 27, 2021. doi: 10.4254/wjh.v13.i2.187
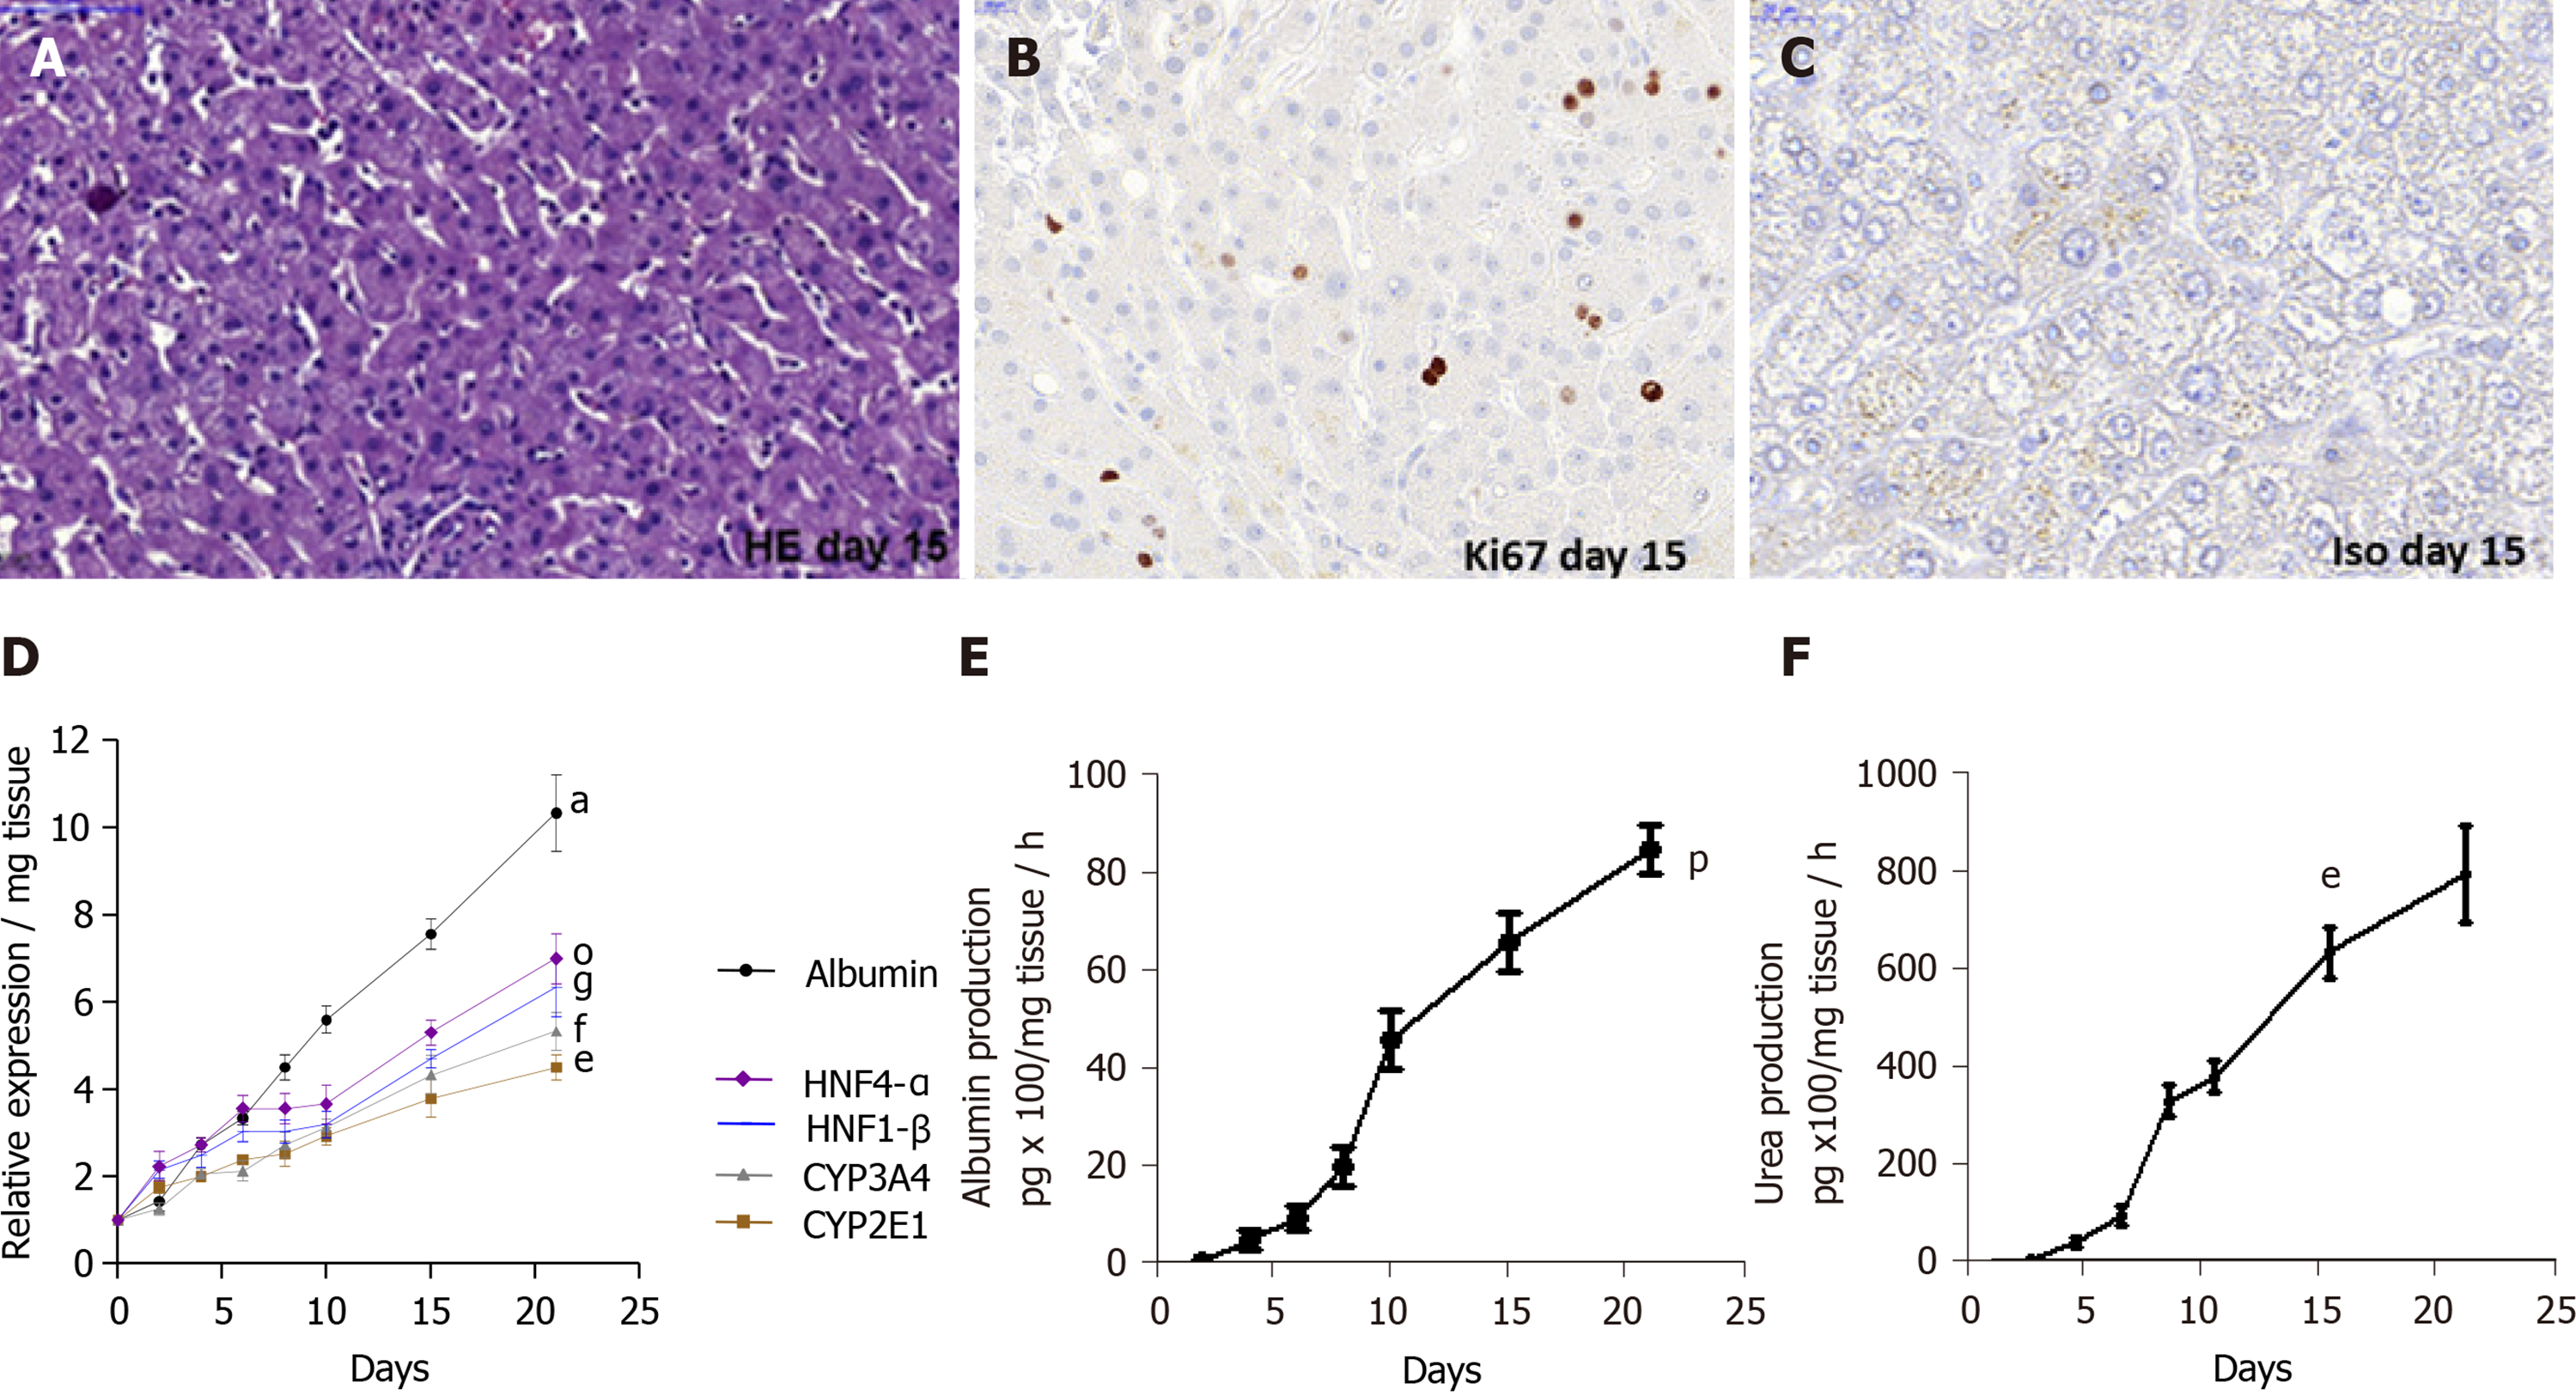
Figure 2 Maintenance of phenotypic characteristics of human non-fibrotic (F0-F1), and fibrotic (F2-F3, F4) liver slices during the culture, demonstrated by histochemistry, real-time reverse transcription-quantitative polymerase chain reaction and biochemical assays.
A: Light microscopy of human liver tissue 7 µm-thick section stained with hematoxylin and eosin showing non-fibrotic (F2-F3) liver lobular architecture on day 15, magnification × 20. Scale bars 100 µm; B: Representative human liver tissue 7 µm-thick sections from fibrotic (F2-F3) liver patient showing immunostaining for Ki67, a proliferation marker, on day 15, magnification × 40, Scale bars, 20 µm; C: Representative human liver tissue 7 µm-thick sections from fibrotic (F2-F3) liver patient showing immunostaining with isotype as negative control, on day 15, magnification × 40, Scale bars, 20 µm; D: Hepatocyte-specific gene mRNA expression (relative expression/mg tissue) during the 21 days follow up studies. Maintenance of hepatocyte-specific gene expression patterns in human non-fibrotic (F0-F1) non-infected liver slices during culture. The real-time reverse transcription-quantitative polymerase chain reaction analyses were performed from five independent human non-fibrotic (F0-F1) livers using slices in triplicate from each liver. All liver-specific gene expression values were normalized to 18S RNA as an internal standard and expressed relative to the zero-time point. Values are expressed as mean ± standard errors. The results were compared using the two-paired Student’s t-test: Albumin: aP < 0.0001; CYP2E1: eP < 0.001; CYP3A4: fP < 0.0003; HNF1-β: gP < 0.01; HNF4-α: oP < 0.008; E and F: Biochemical functional assays; E: Albumin production (pg x 100/mg tissue/hour) during the 21 days follow up studies; and F: Urea production (pg/mg tissue/hour) during the 21 days follow up studies. Studies were done in triplicate and repeated twice for each liver sample. Values are expressed as means ± standard errors (n = 5). The results were compared using the two-paired Student’s t-test: albumin production (pP < 0.02), urea production (eP < 0.001).
- Citation: Kartasheva-Ebertz D, Gaston J, Lair-Mehiri L, Massault PP, Scatton O, Vaillant JC, Morozov VA, Pol S, Lagaye S. Adult human liver slice cultures: Modelling of liver fibrosis and evaluation of new anti-fibrotic drugs. World J Hepatol 2021; 13(2): 187-217
- URL: https://www.wjgnet.com/1948-5182/full/v13/i2/187.htm
- DOI: https://dx.doi.org/10.4254/wjh.v13.i2.187


