Copyright
©The Author(s) 2021.
World J Hepatol. Nov 27, 2021; 13(11): 1568-1583
Published online Nov 27, 2021. doi: 10.4254/wjh.v13.i11.1568
Published online Nov 27, 2021. doi: 10.4254/wjh.v13.i11.1568
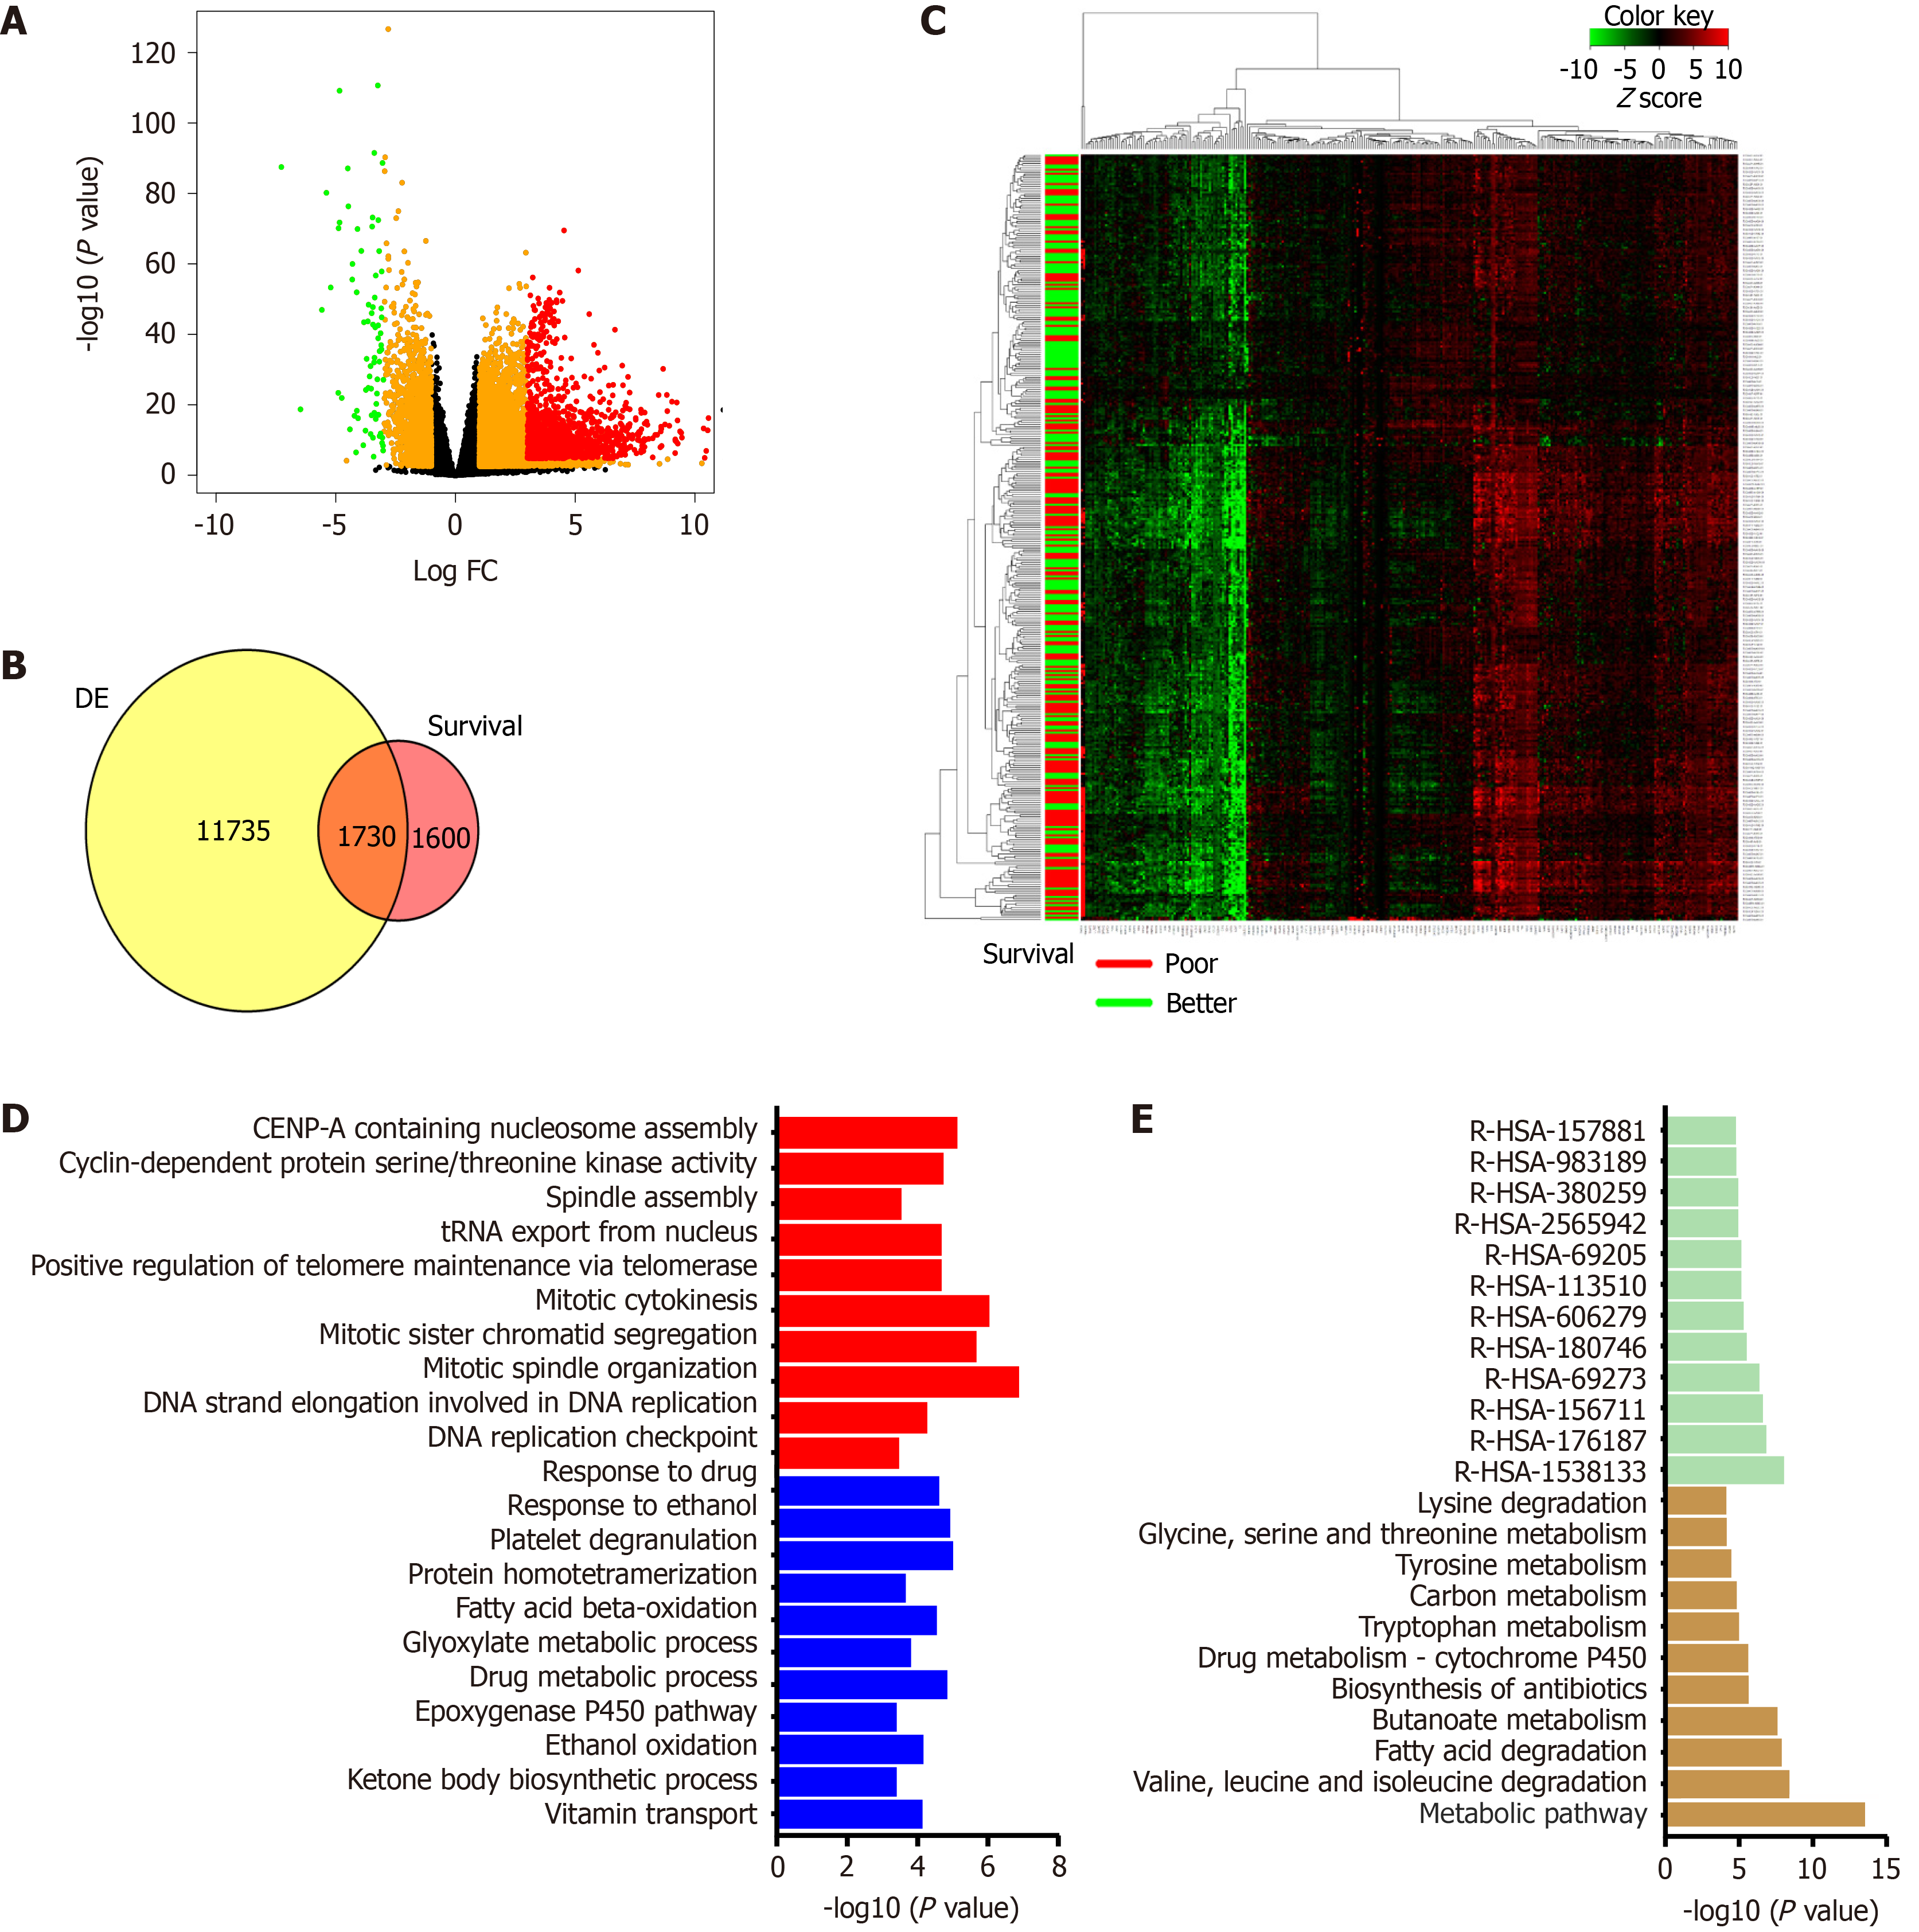
Figure 3 The cancer genome atlas liver hepatocellular carcinoma data analysis.
A: Volcano plot representing differential gene expression between 373 tumor samples and 50 normal samples. Genes colored with red or green are most significantly altered; B: Venn diagram showing overlap between differentially expressed gene list and genes affecting survival of patients upon alteration (survival); C: Normalized expression of top 300 genes associated with overall survival represented using heatmap. Patients with overall survival below the median are marked with a red bar while those above the median are marked with a green bar; D: Altered biological process from overlap gene. Upregulated processes highlighted with red and downregulated processes are depicted as blue; E: Pathways analysis for overlap genes. Deregulated KEGG pathways shown by yellow bars and reactome pathways displayed using green bars. DE: Differentially expressed gene list.
- Citation: Natu A, Singh A, Gupta S. Hepatocellular carcinoma: Understanding molecular mechanisms for defining potential clinical modalities. World J Hepatol 2021; 13(11): 1568-1583
- URL: https://www.wjgnet.com/1948-5182/full/v13/i11/1568.htm
- DOI: https://dx.doi.org/10.4254/wjh.v13.i11.1568


