Copyright
©The Author(s) 2020.
World J Hepatol. Jun 27, 2020; 12(6): 298-311
Published online Jun 27, 2020. doi: 10.4254/wjh.v12.i6.298
Published online Jun 27, 2020. doi: 10.4254/wjh.v12.i6.298
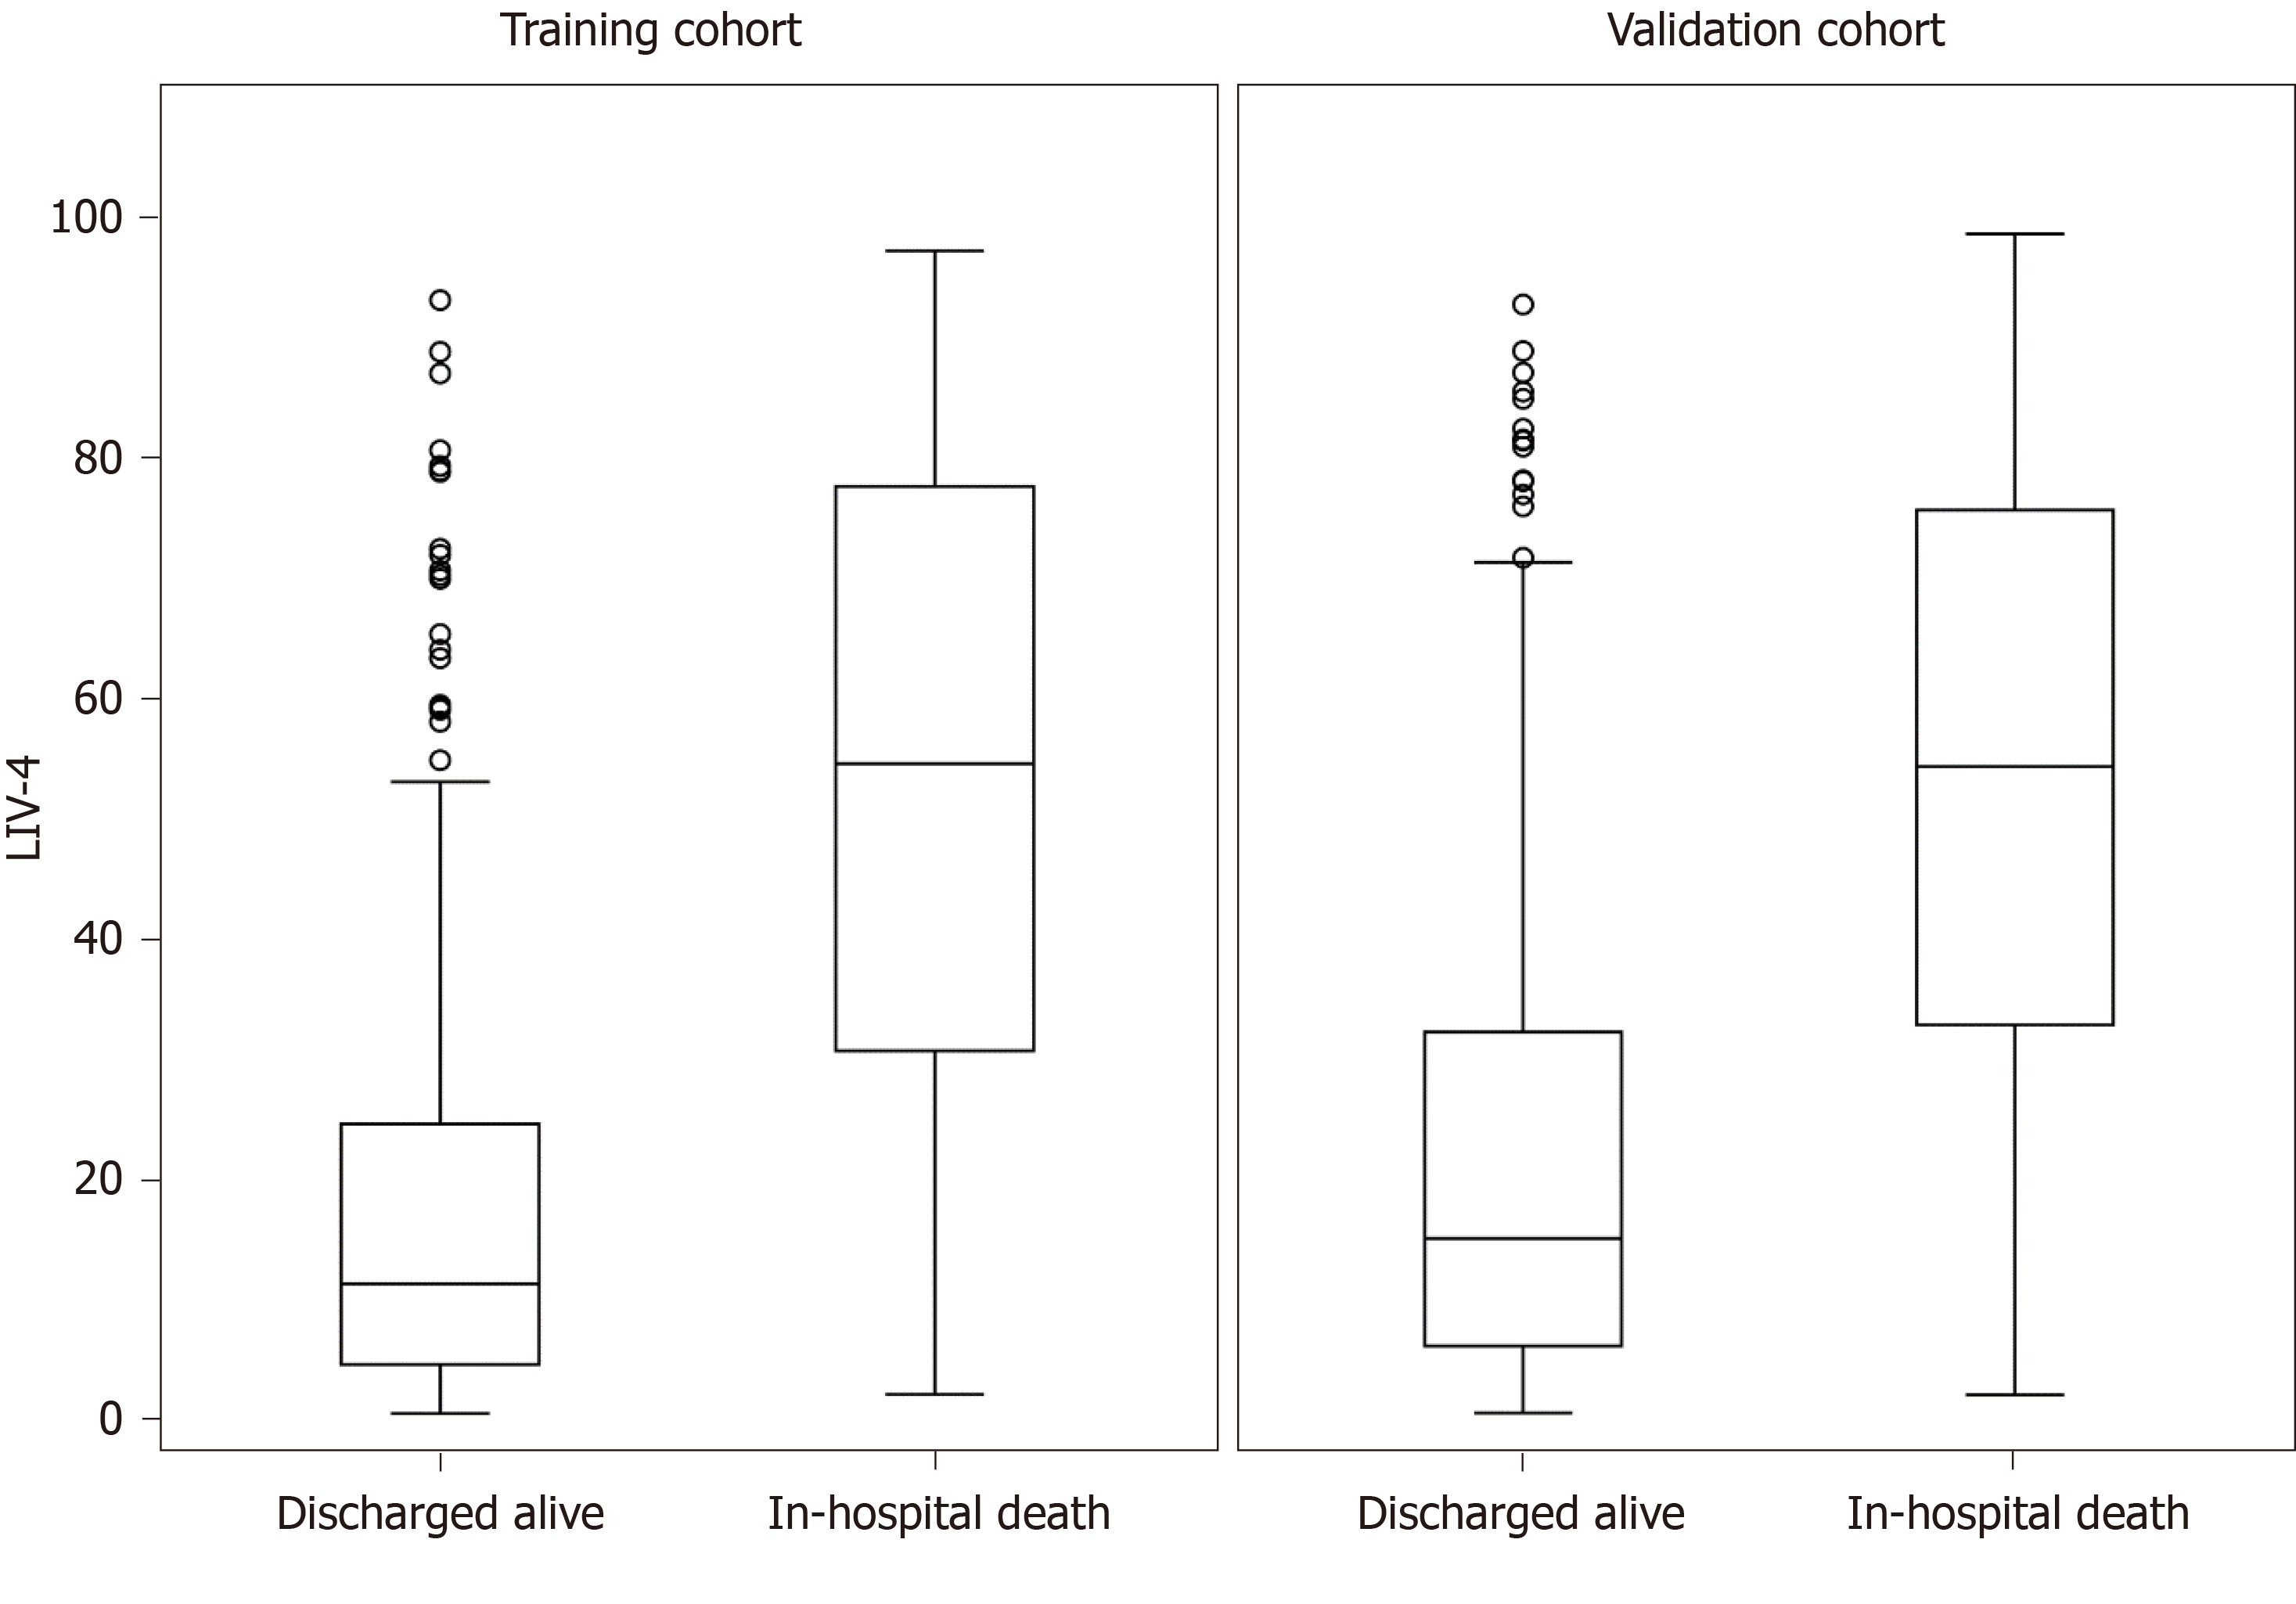
Figure 2 LIV-4 score is higher in subjects who expired during the hospital admission.
The box-and-whisker plot is represented by the lower boundary of the box indicating the 25th percentile, the line within the box indicating the median value, the upper boundary of the box indicating the 75th percentile. The whiskers extend to the most extreme data point, which is no more than 1.5 times the interquartile range from the box, and the circles are outliers (values > 1.5 interquartile range).
- Citation: Lindenmeyer CC, Flocco G, Sanghi V, Lopez R, Kim AJ, Niyazi F, Mehta NA, Kapoor A, Carey WD, Mireles-Cabodevila E, Romero-Marrero C. LIV-4: A novel model for predicting transplant-free survival in critically ill cirrhotics. World J Hepatol 2020; 12(6): 298-311
- URL: https://www.wjgnet.com/1948-5182/full/v12/i6/298.htm
- DOI: https://dx.doi.org/10.4254/wjh.v12.i6.298


