Copyright
©The Author(s) 2020.
World J Hepatol. Apr 27, 2020; 12(4): 149-159
Published online Apr 27, 2020. doi: 10.4254/wjh.v12.i4.149
Published online Apr 27, 2020. doi: 10.4254/wjh.v12.i4.149
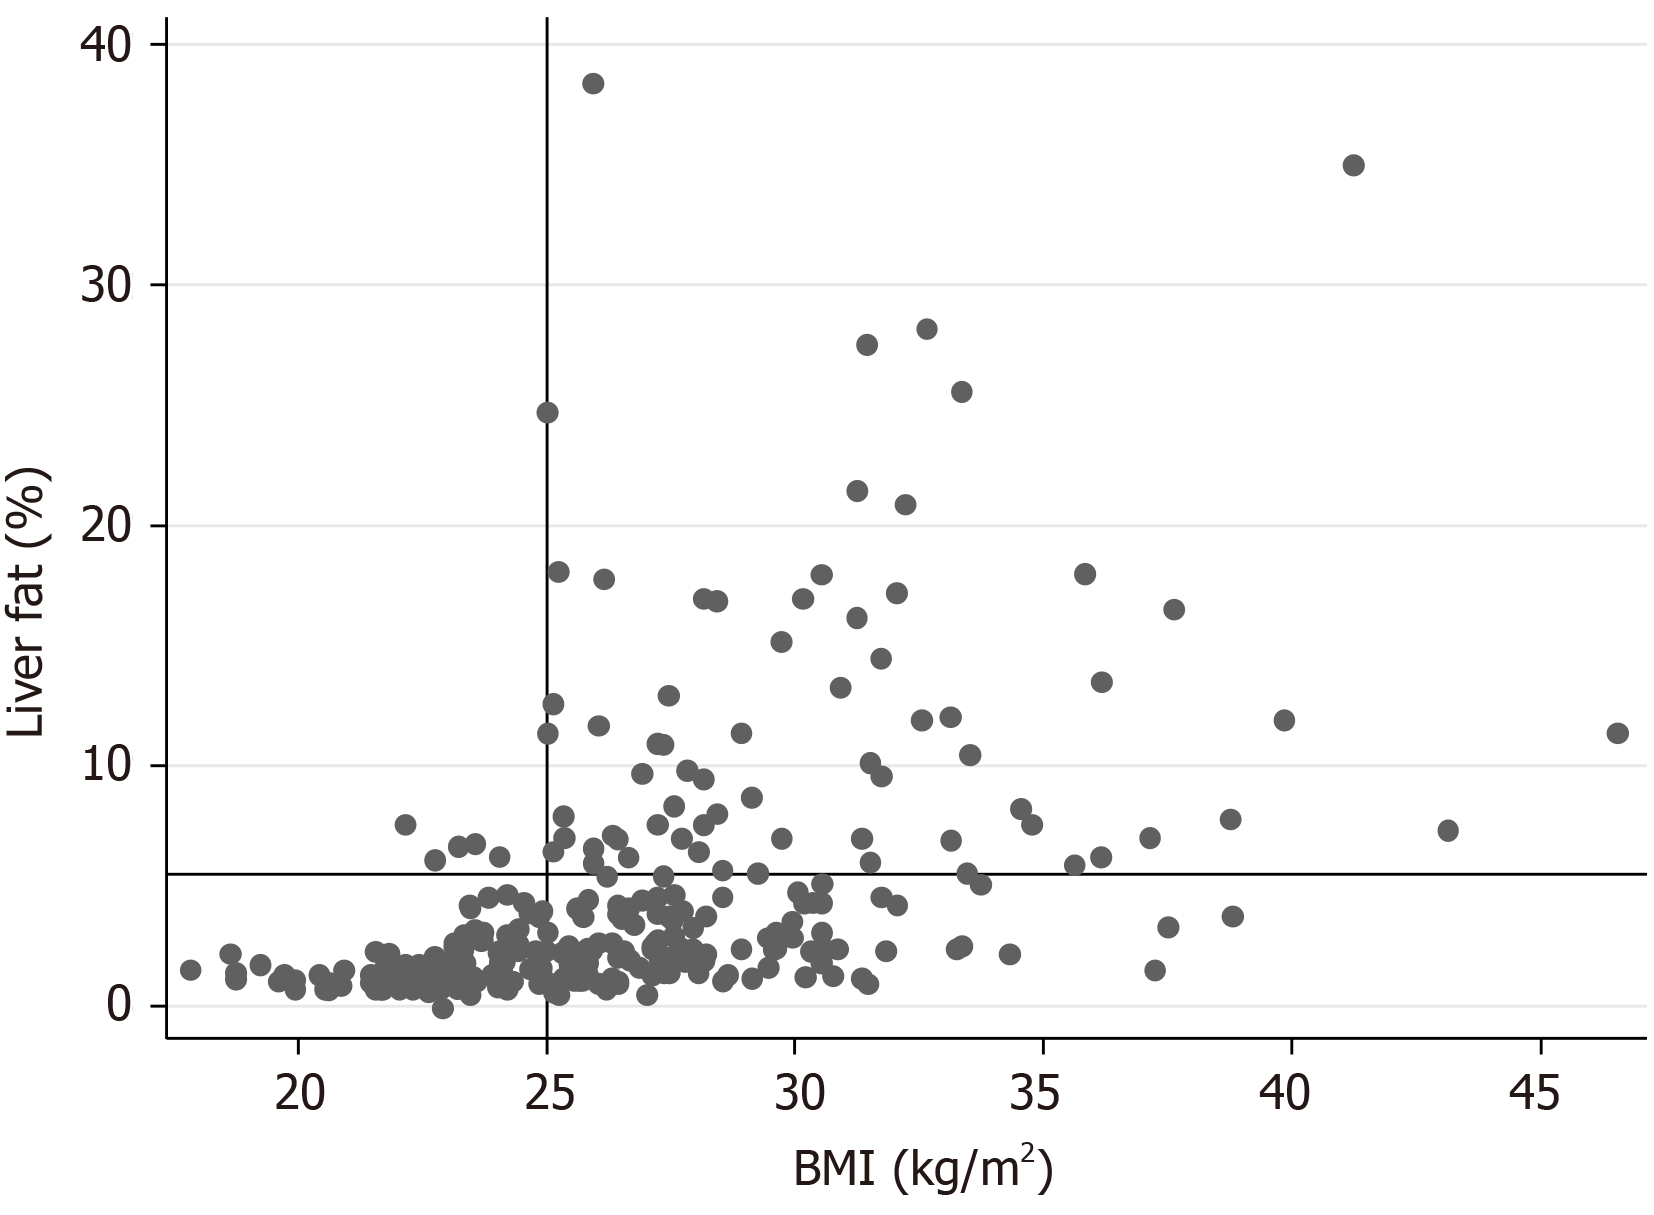
Figure 1 Relationship between body mass index and liver fat in the population-based prospective investigation of obesity, energy and metabolism study.
The horizontal line indicates a liver fat of 5.5%, the limit for non-alcoholic fatty liver disease, while the vertical line indicates a body mass index of 25 kg/m2. BMI: Body mass index.
- Citation: Lind L, Johansson L, Ahlström H, Eriksson JW, Larsson A, Risérus U, Kullberg J, Oscarsson J. Comparison of four non-alcoholic fatty liver disease detection scores in a Caucasian population. World J Hepatol 2020; 12(4): 149-159
- URL: https://www.wjgnet.com/1948-5182/full/v12/i4/149.htm
- DOI: https://dx.doi.org/10.4254/wjh.v12.i4.149


