Copyright
©The Author(s) 2020.
World J Hepatol. Dec 27, 2020; 12(12): 1228-1238
Published online Dec 27, 2020. doi: 10.4254/wjh.v12.i12.1228
Published online Dec 27, 2020. doi: 10.4254/wjh.v12.i12.1228
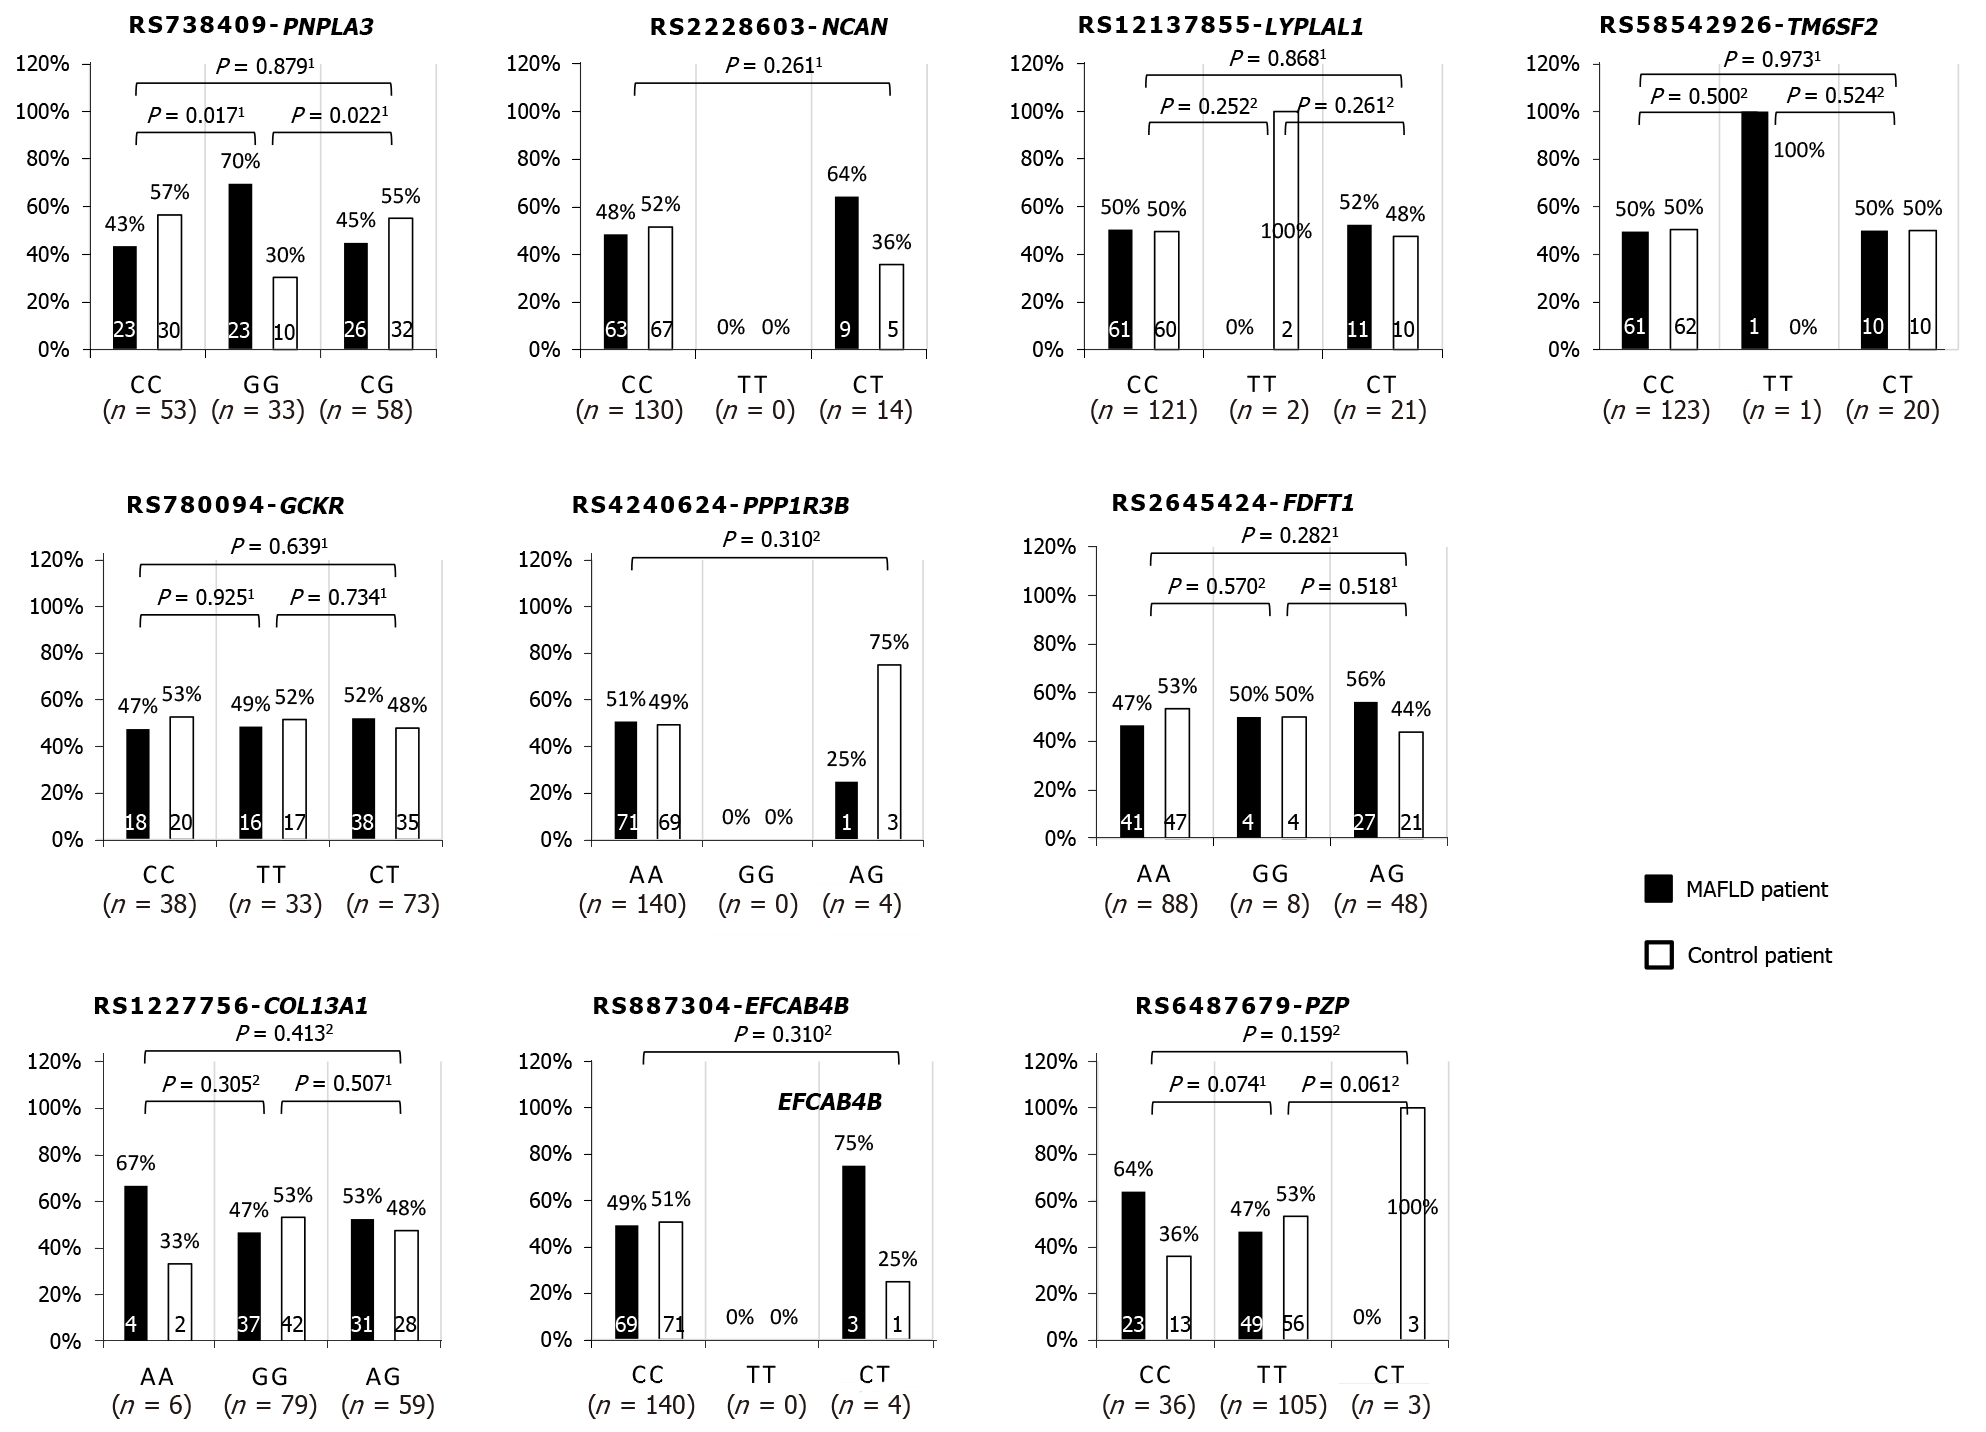
Figure 1 Single nucleotide polymorphisms in patients with or without metabolic dysfunction-associated fatty liver disease.
The bar charts represent the percent of each allele comparing metabolic dysfunction-associated fatty liver disease (MAFLD) patients (blue) and controls (green). 1Chi-squared test; 2Fisher’s exact test.
- Citation: Lee GH, Phyo WW, Loo WM, Kwok R, Ahmed T, Shabbir A, So J, Koh CJ, Hartono JL, Muthiah M, Lim K, Tan PS, Lee YM, Lim SG, Dan YY. Validation of genetic variants associated with metabolic dysfunction-associated fatty liver disease in an ethnic Chinese population. World J Hepatol 2020; 12(12): 1228-1238
- URL: https://www.wjgnet.com/1948-5182/full/v12/i12/1228.htm
- DOI: https://dx.doi.org/10.4254/wjh.v12.i12.1228


