Copyright
©The Author(s) 2020.
World J Hepatol. Nov 27, 2020; 12(11): 1115-1127
Published online Nov 27, 2020. doi: 10.4254/wjh.v12.i11.1115
Published online Nov 27, 2020. doi: 10.4254/wjh.v12.i11.1115
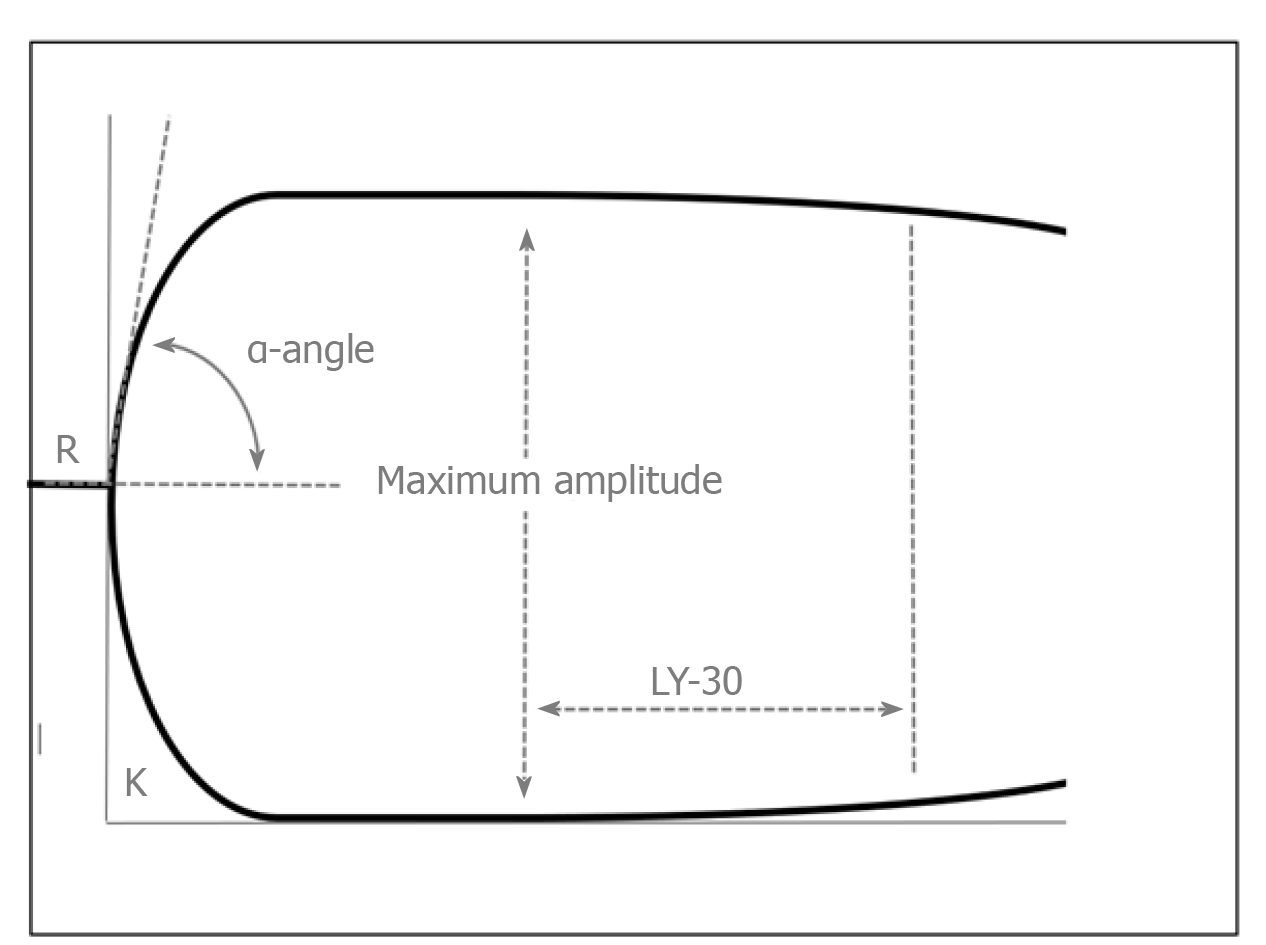
Figure 2 Example of a thromboelastography tracing.
Five parameters are routinely measured on thromboelastography (TEG). The reaction (R) time is recorded in minutes and measures the time taken from the start of blood clotting until initial fibrin formation, defined as when the TEG trace amplitude reaches 2 mm. R is dependent on coagulation factors and generally corresponds to INR/PT. The kinetic (K) time assesses the rate of clot formation. It is measured from R to the point where the trace amplification reaches 20 mm which corresponds to standard clot firmness. The K value is dependent on the clotting factors of the intrinsic pathway, fibrinogen and platelets. The α-angle also corresponds to the kinetics of clot formation and is measured from a line drawn from the base-line to the tangent of the curve at R. The maximum amplitude (MA) of the trace reflects clot strength and is largely dependent on platelet count/ function and to a lesser extent, fibrinogen concentration. Clot lysis is measured at 30 min (Ly-30) and reflects the degree of fibrinolysis.
- Citation: Wei H, Child LJ. Clinical utility of viscoelastic testing in chronic liver disease: A systematic review. World J Hepatol 2020; 12(11): 1115-1127
- URL: https://www.wjgnet.com/1948-5182/full/v12/i11/1115.htm
- DOI: https://dx.doi.org/10.4254/wjh.v12.i11.1115


