Copyright
©The Author(s) 2019.
World J Hepatol. Feb 27, 2019; 11(2): 186-198
Published online Feb 27, 2019. doi: 10.4254/wjh.v11.i2.186
Published online Feb 27, 2019. doi: 10.4254/wjh.v11.i2.186
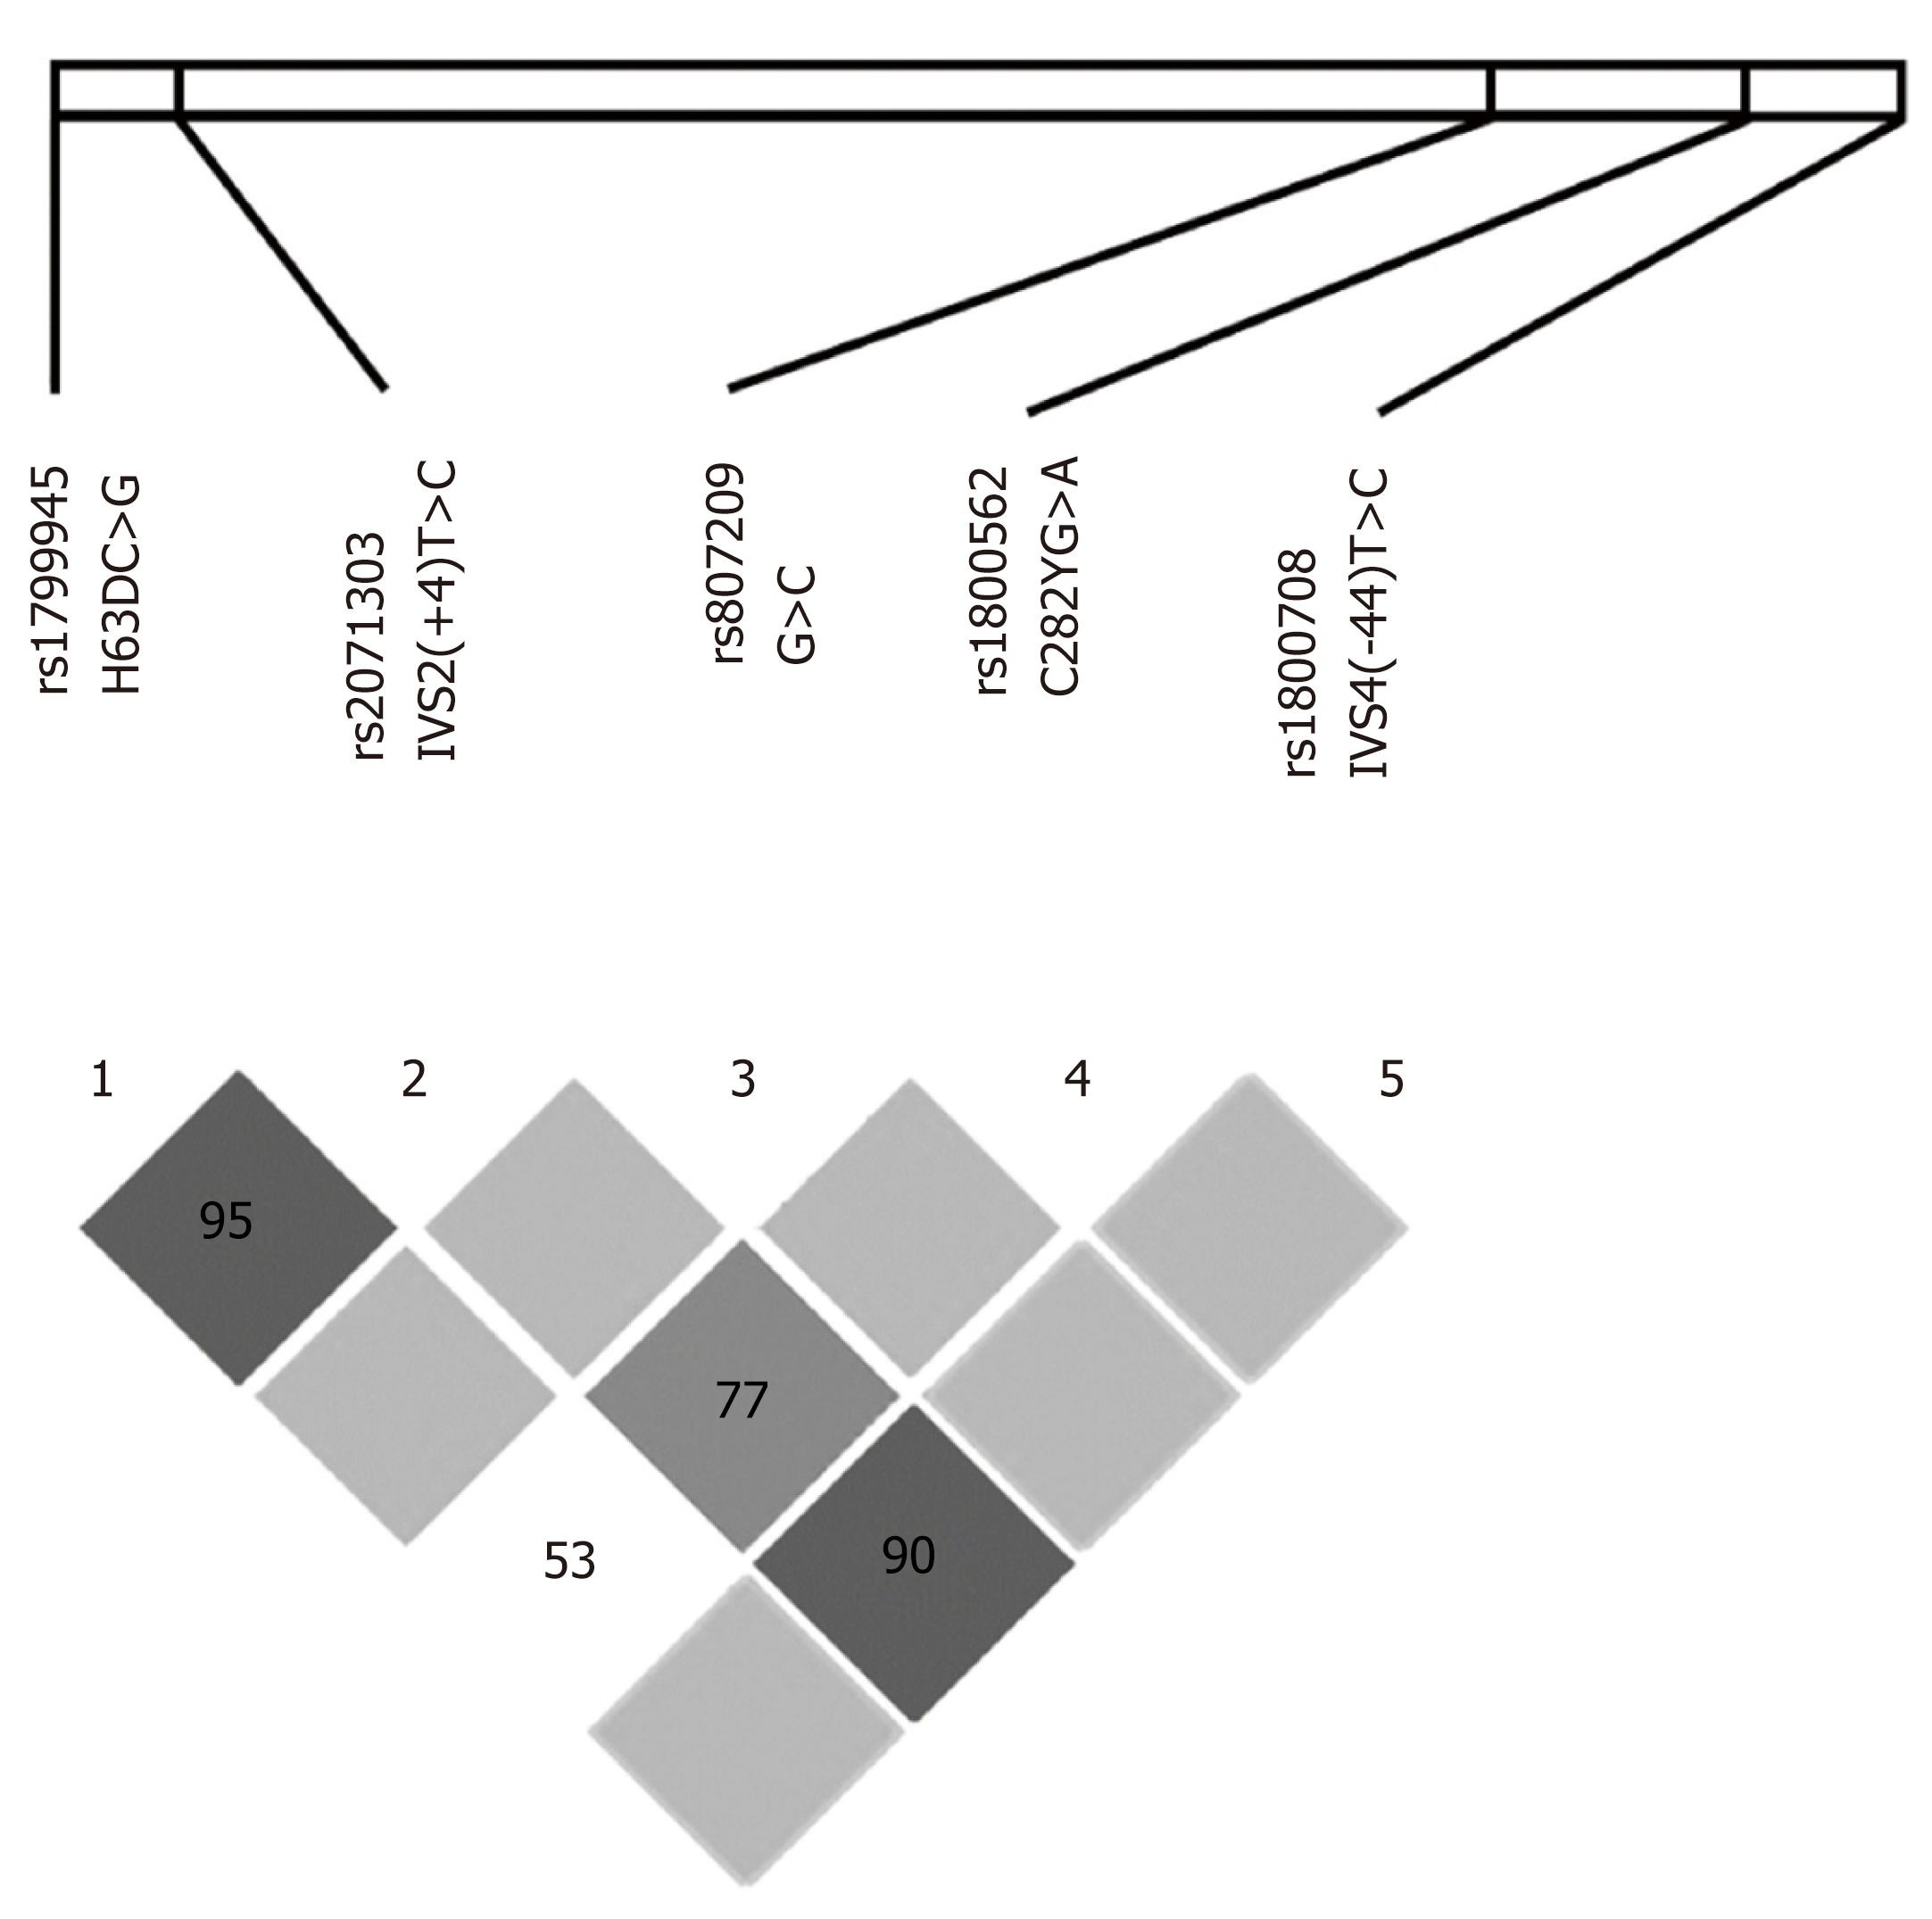
Figure 2 Linkage disequilibrium among single nucleotide polymorphisms observed along the coding region of the HFE gene.
Areas in dark gray represent strong linkage disequilibrium (LD) (LOD ≥ 2 and D' = 1), medium gray indicates moderate LD (LOD ≥ 2, D’ < 1), light gray indicates weak LD (LOD < 2, D' = 1); and white indicates no LD (LOD < 2, D’ < 1). Values of D' different from 1.00 are represented as a percentage within the square. LOD: Log of the odds; D': Linkage disequilibrium coefficient.
- Citation: de Campos WN, Massaro JD, Cançado ELR, Wiezel CEV, Simões AL, Teixeira AC, Souza FF, Mendes-Junior CT, Martinelli ALC, Donadi EA. Comprehensive analysis of HFE gene in hereditary hemochromatosis and in diseases associated with acquired iron overload. World J Hepatol 2019; 11(2): 186-198
- URL: https://www.wjgnet.com/1948-5182/full/v11/i2/186.htm
- DOI: https://dx.doi.org/10.4254/wjh.v11.i2.186


