Copyright
©The Author(s) 2019.
World J Hepatol. Dec 27, 2019; 11(12): 773-779
Published online Dec 27, 2019. doi: 10.4254/wjh.v11.i12.773
Published online Dec 27, 2019. doi: 10.4254/wjh.v11.i12.773
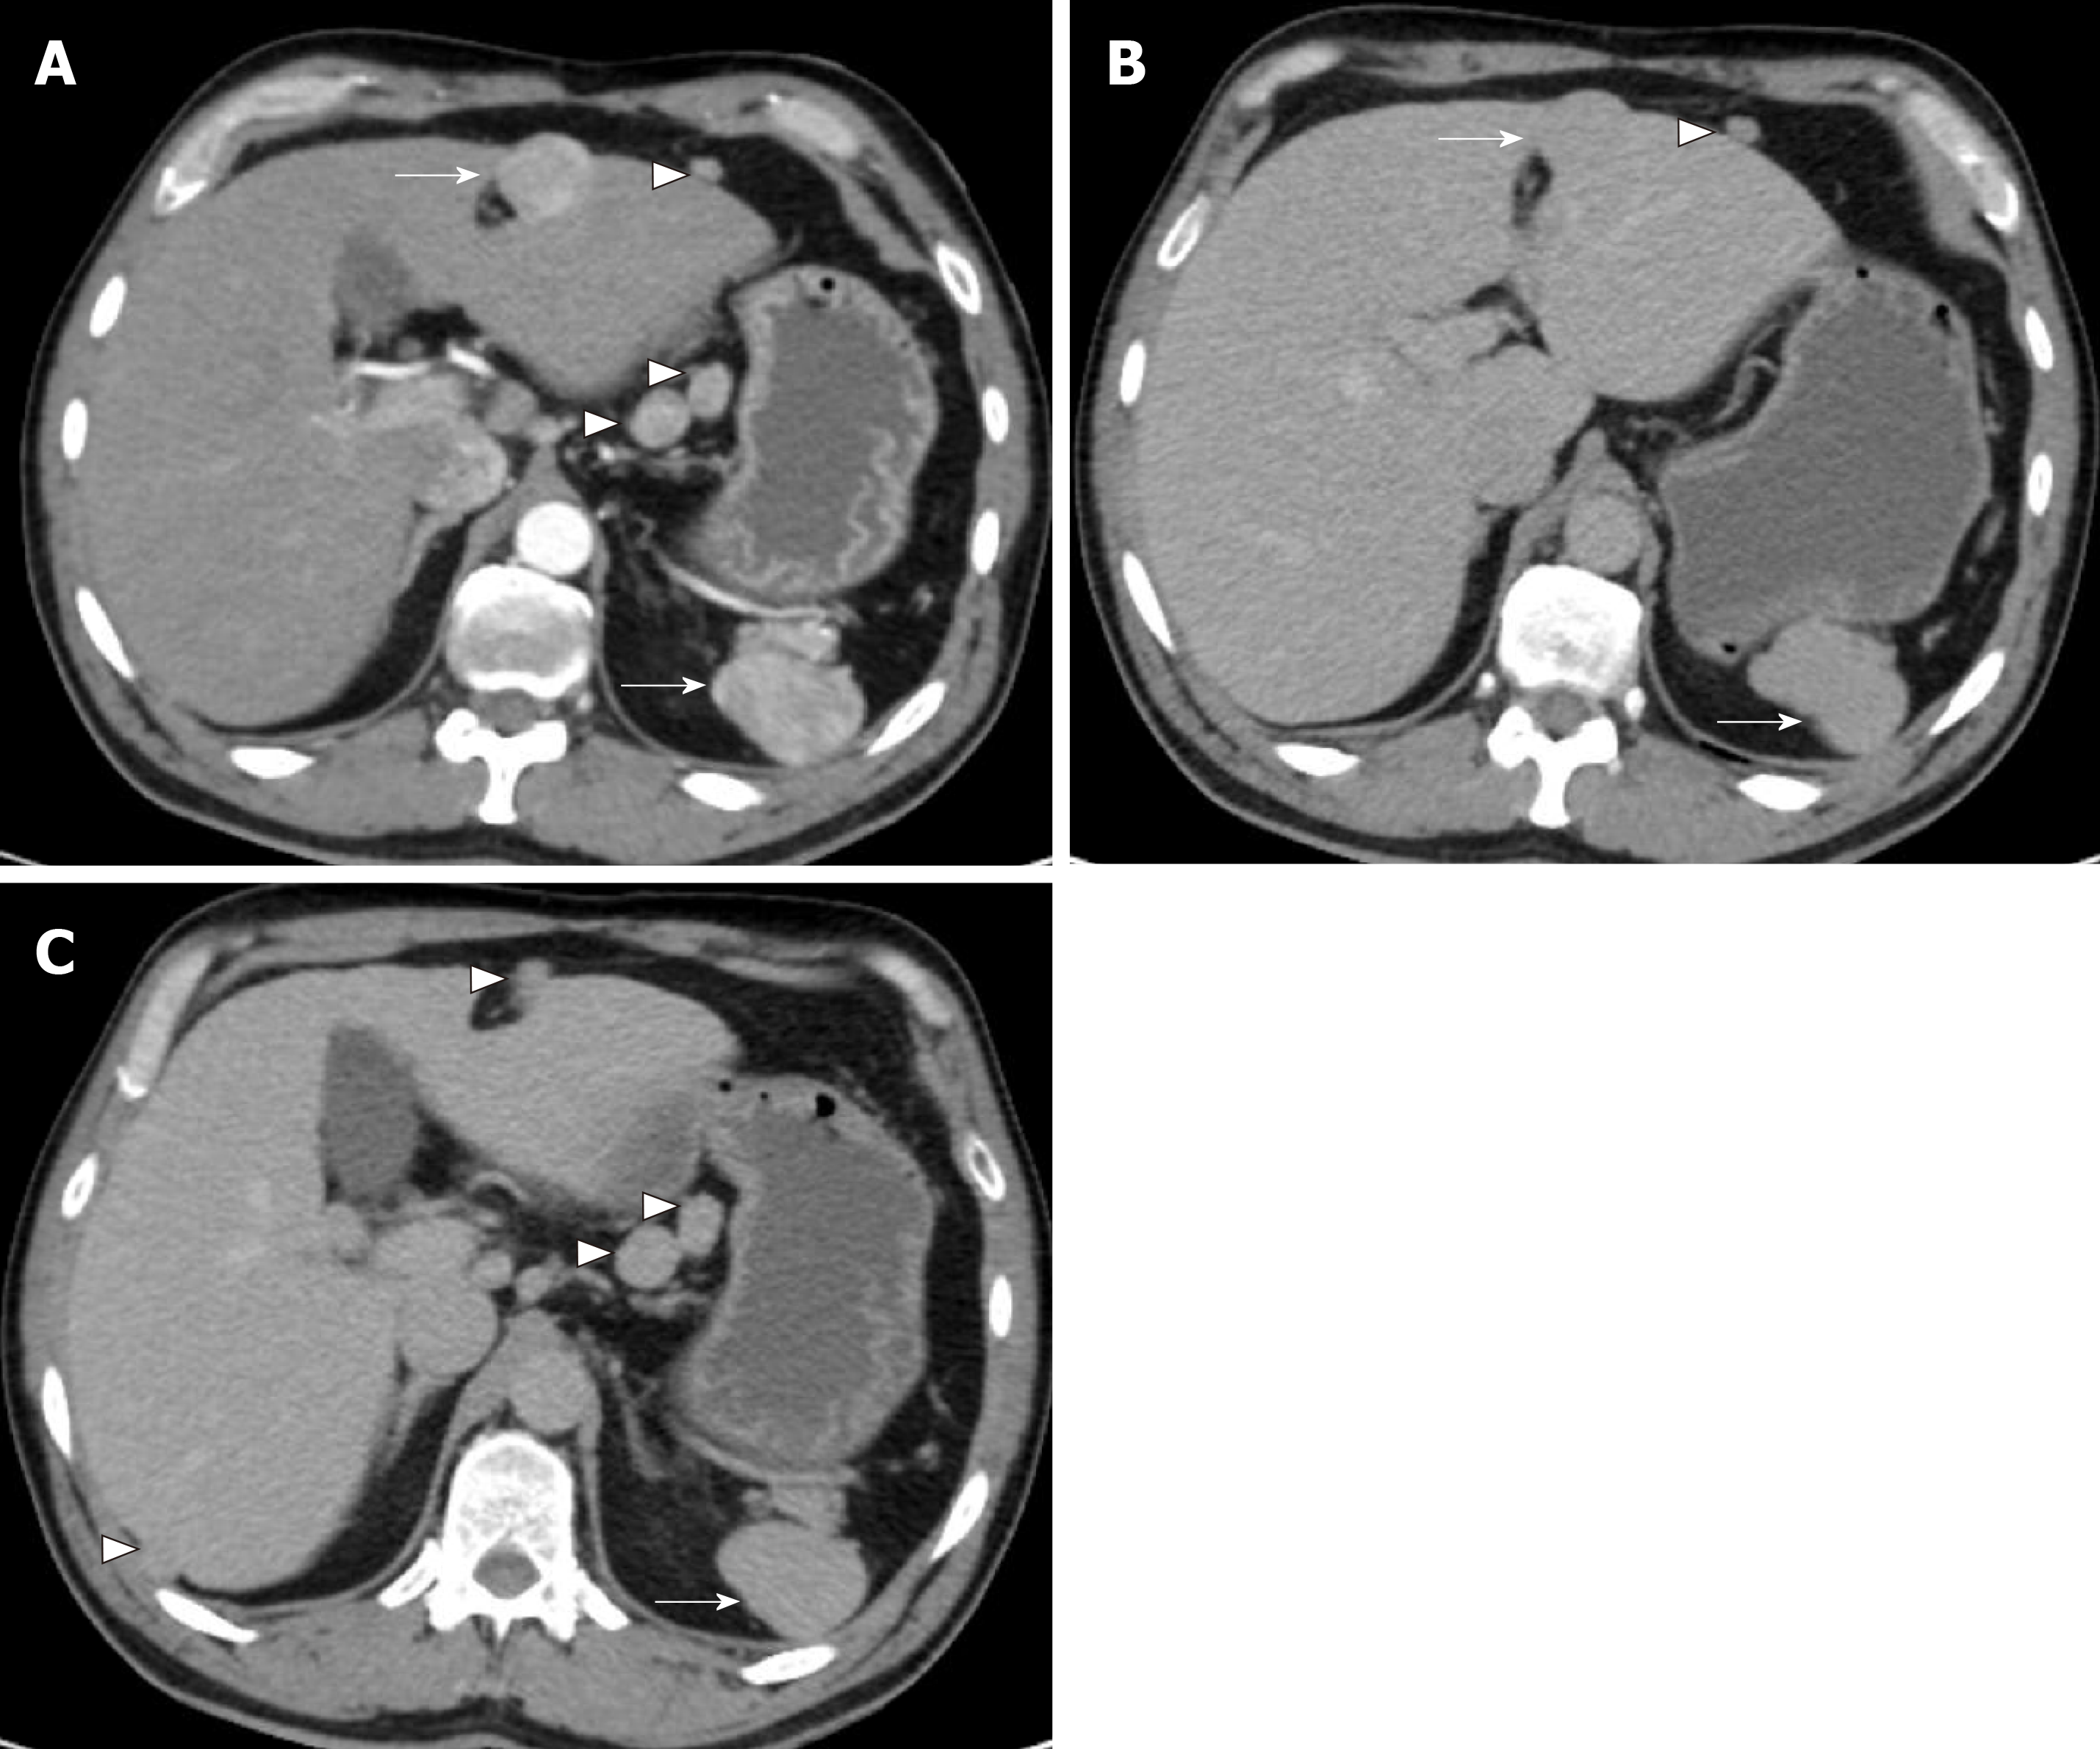
Figure 1 Computed tomography axial images from a patient with intrahepatic splenosis.
A: arterial phase; a heterogenously enhancing left lobe liver lesion is present 3 cm in diameter (thick arrow). Similar heterogeneously enhancing peritoneal and lesser sac nodules are seen (arrowhead). The deformed spleen shows typical heterogenous “zebra stripe” arterial enhancement; B and C: portal venous phase; the liver lesion (thick arrow) and the peritoneal and retroperitoneal nodules (arrowhead) are isodense and the same density as the spleen (thin arrow).
- Citation: Ananthan K, Yusuf GT, Kumar M. Intrahepatic and intra-abdominal splenosis: A case report and review of literature. World J Hepatol 2019; 11(12): 773-779
- URL: https://www.wjgnet.com/1948-5182/full/v11/i12/773.htm
- DOI: https://dx.doi.org/10.4254/wjh.v11.i12.773


