Copyright
©The Author(s) 2018.
World J Hepatol. Aug 27, 2018; 10(8): 530-542
Published online Aug 27, 2018. doi: 10.4254/wjh.v10.i8.530
Published online Aug 27, 2018. doi: 10.4254/wjh.v10.i8.530
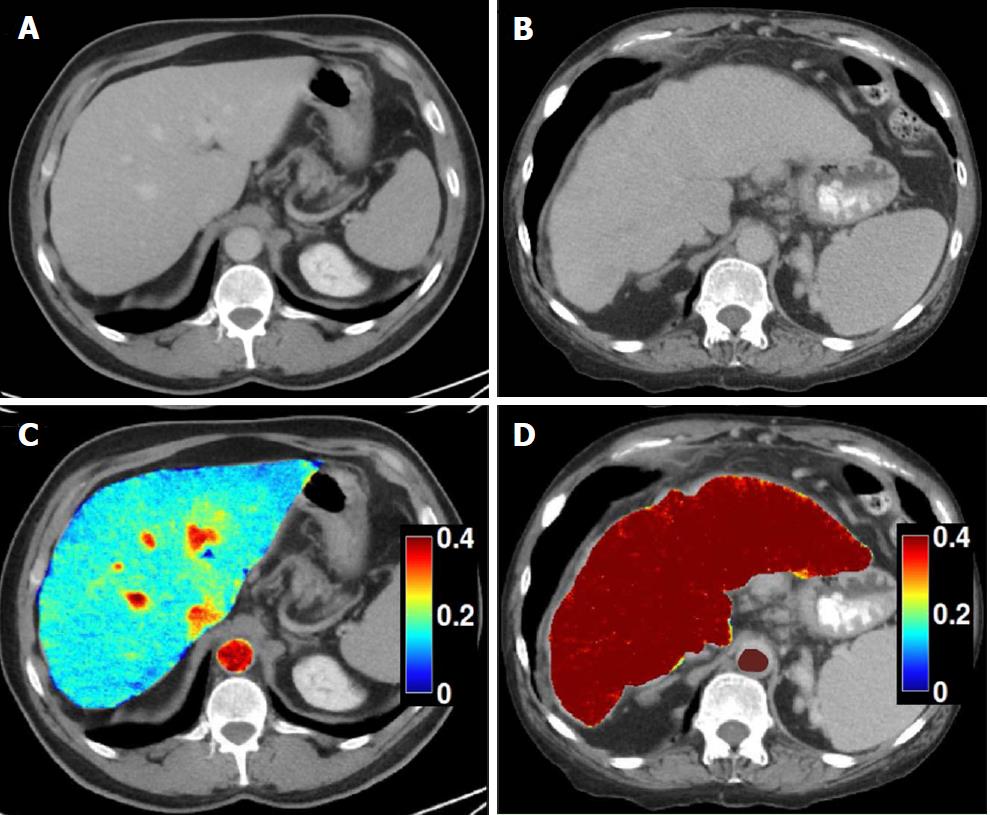
Figure 6 Dual-energy CT images for the assessment of liver fibrosis.
A: Delayed phase axial CT images from a patient with mild fibrosis; B: Severe fibrosis; C-D: DECT color overlay contrast agent maps. Iodine concentration within the liver parenchyma in reference to that in the aorta [NIC (normalized iodine concentration) in mg/mL = I Liver / I Aorta] on 5 min delayed acquisitions can be seen on the images. Since contrast media is retained within fibrotic tissues, the NIC on delayed-phase images increases with the severity of liver fibrosis; D: Patients with severe cirrhosis have higher parenchymal contrast media retention on delayed images in relationship to the aorta, as compared to the mild retention in patients with lesser grades of liver fibrosis (C).
- Citation: Li Q, Dhyani M, Grajo JR, Sirlin C, Samir AE. Current status of imaging in nonalcoholic fatty liver disease. World J Hepatol 2018; 10(8): 530-542
- URL: https://www.wjgnet.com/1948-5182/full/v10/i8/530.htm
- DOI: https://dx.doi.org/10.4254/wjh.v10.i8.530


